Extend Handler - Metrics
Extend is in Open Beta for AGS Private Cloud! This means that the Extend add-on is available for you to try in your development environment. You can submit your feedback via our Extend Open Beta feedback form.
List of metrics
non-message_type
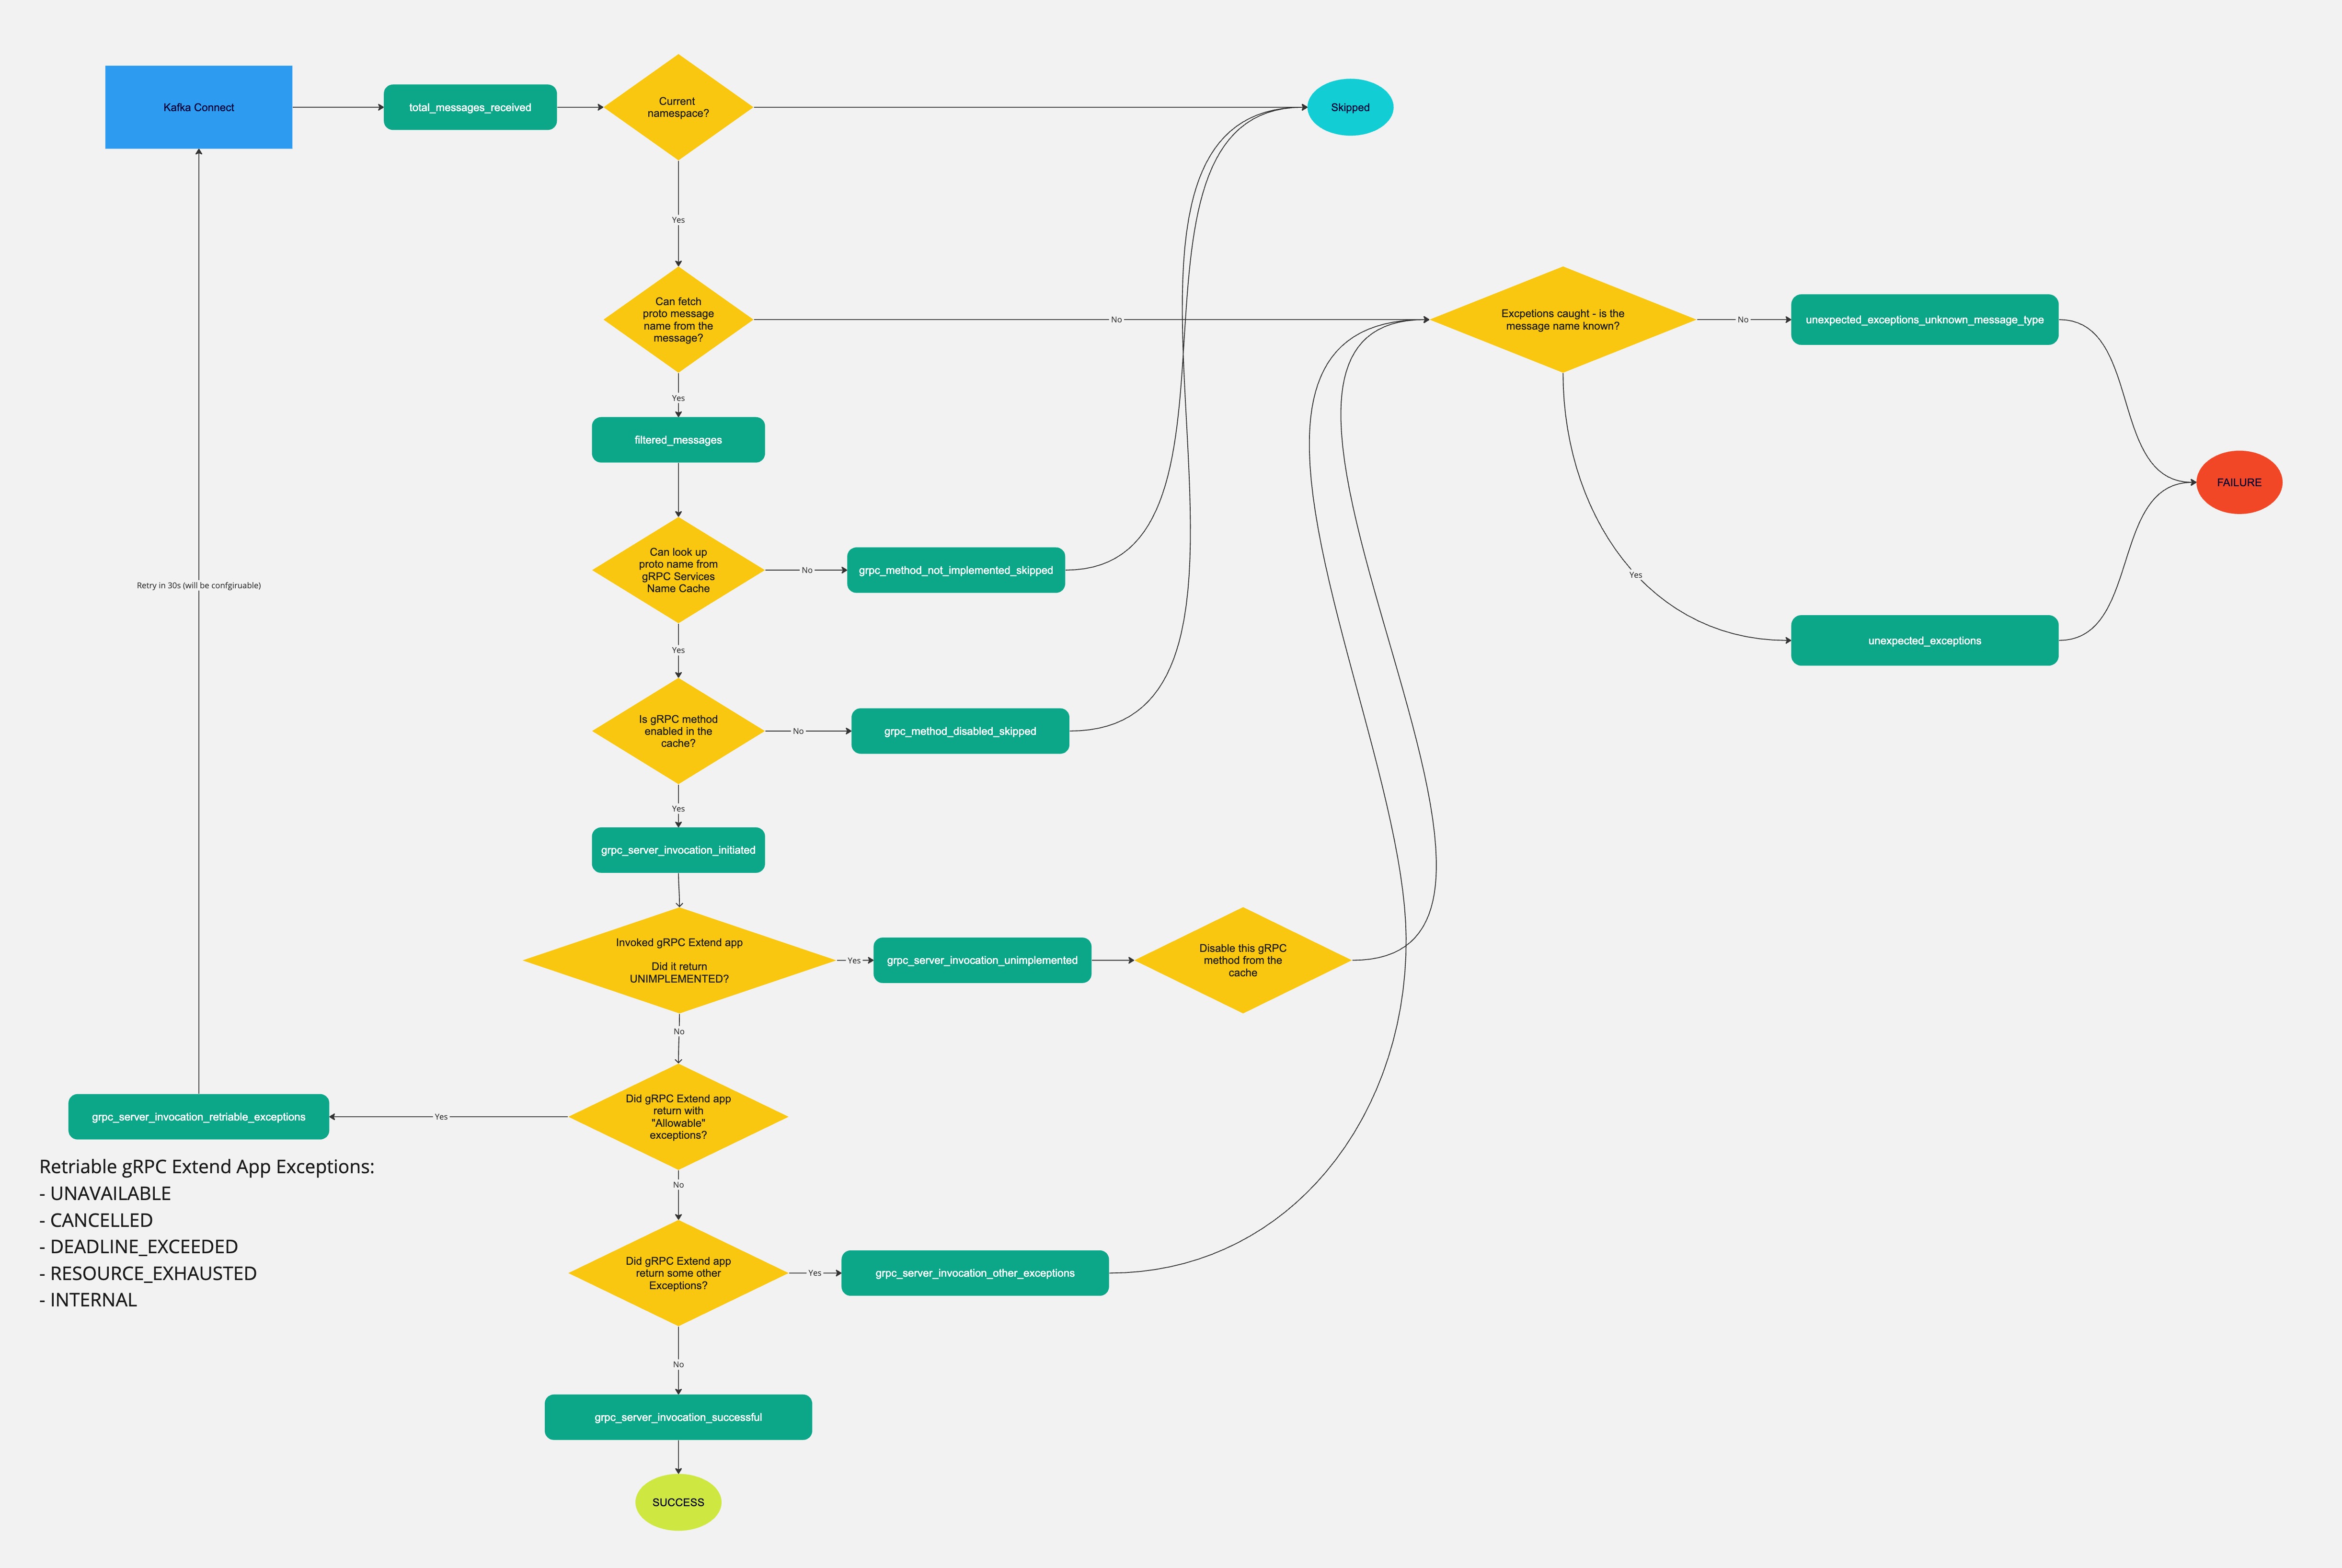
total_messages_received: a top-level metric that is incremented whenever a message is received. When this metric is incremented, the Kafka Sink Connector is receiving messages coming from Kafka before any further processing takes place.
message_type
filtered_messages: a metric for the number of messages being processed with readable proto message names. The proto message name is used to map which gRPC call to make.grpc_method_not_implemented_skipped: indicates that the gRPC can't be found to call from the gRPC services name cache. As a result, the gRPC method invocation is skipped. gRPC services name cache is built when the connector first starts up and queries the list of methods by gRPC reflection against the gRPC server. Before any gRPC is invoked, this cache will be checked first.grpc_method_disabled_skipped: indicates that the gRPC services name cache is found via gRPC reflection, but the status is disabled. It's disabled for optimization due to being previously disabled when invoked but was IMPLEMENTED from the gRPC server. At the same time,grpc_server_invocation_unimplementedis also incremented. See metricgrpc_server_invocation_unimplementedfor details. The gRPC invocation being skipped should be an impossible case given that the gRPC server and the connector for the list of implemented methods should be always in sync given they live in the same pod.
Flow
After successfully reading and looking up the message name from the mapping files:
rpc_server_invocation_initiatedgets incremented then invokes the gRPC Extend app mapped method.
Upon gRPC server invocation:
grpc_server_invocation_successfulgets incremented when the gRPC Extend app successfully replies back to the Extend app with status codeOK.grpc_server_invocation_unimplementedinvokes the gRPC Extend app but the app responded with UNIMPLEMENTED. This happens because the gRPC services name cache in the connector -- which is a sidecar with the gRPC Extend app -- was built after the gRPC Extend app was fully started.grpc_server_invocation_retriable_exceptionsinvokes the gRPC Extend app but the app responded with allowable exceptions that are deemed to be retriable:List of retriable gRPC Extend App exceptions:
- UNAVAILABLE
- CANCELLED
- DEADLINE_EXCEEDED
- RESOURCE_EXHAUSTED
- INTERNAL
grpc_server_invocation_other_exceptions: gRPC is invoked but the gRPC Extend app replied with other exceptions that are not deemed retriable.
Overall exceptions metrics
unexpected_exceptions_unknown_message_type: indicates that there are non-retriable exceptions that can't distinguish what exact message type (the proto message name) it is from the Kafka message.unexpected_exceptions: indicates that there are non-retriable exceptions that can distinguish what message type (proto message name) it is from the Kafka message.
Metrics naming convention
The naming convention for metrics is as follows:
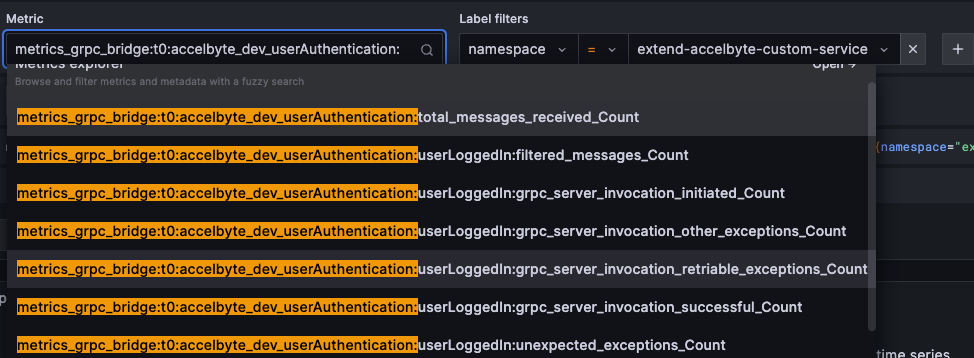
metrics_grpc_bridge:`<task_connector_id>`:`<topic>`:`<message_type_if_applicable>`:`<metric_name>`_Count
Example
In this example, with task connector instance ID 0 and topic accelbyte_dev_userAuthentication, the metrics are identified as follows:
- The first one is a top-level metric, belonging to
total_messages_receivedfor the topic. - The rest are metrics belonging to message type (proto message name):
userLoggedIn.