エクステンドオーバーライドの可観測性
Overview
You can use Grafana Cloud with AccelByte Gaming Services (AGS) to:
-
use Grafana's query editor that allows you to specify the exact logs, and metrics data you want to retrieve. You can pick the data source for logs or metrics by accessing the dropdown on the top.
ヒントData sources for your application usually follow the pattern
log-<your studio name>ormetrics-<your studio name>. -
use Grafana's logging, and metrics capabilities to enable effective debugging of the Overridable Features.
Prerequisite
- The steps in this guide use the Extend Override app described in Getting started with matchmaking customization as the practical example. Ensure that the Extend override app has been deployed.
Dashboard overview
You can access the Grafana Cloud dashboard for your Extend app from the AGS Admin Portal. For more information, see the Access Grafana Cloud dashboards guide.
The Grafana Cloud dashboards for Extend Override apps have various tabs and panels that will become visible. One important feature to note is the hamburger button (three horizontal lines) located in the top-left corner of the screen. This menu allows you to access the following important components:
Home: the starting point that offers a quick overview of various dashboards and settings.
Dashboard: displays pre-configured panels displaying data for logs and metrics. Accessible through the hamburger button.
Explore: this is where logs and metrics can be queried manually. To access this, click on the hamburger button and select Explore. In the Explore tab, the Data Sources dropdown allows you to select specific data sources, such as Loki for logs, Tempo for traces, and others for metrics. You can use these data sources for debugging purposes.
Work with logs
- To initiate work with logs, select the source.
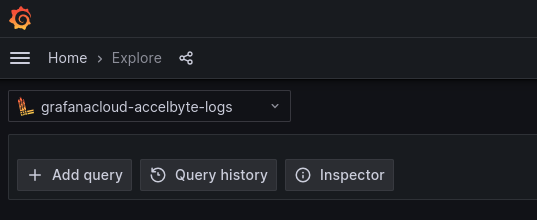
- Include or remove multiple queries as required. With the source selected, click the Add query button. Additionally, Grafana can also display the query history through the Query history button.
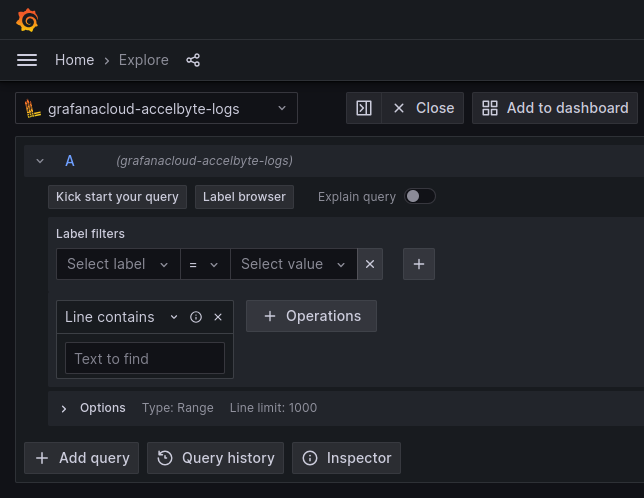
- Choose the dropdown for label filters and the corresponding value to filter the log. Adjust labels as needed and use the Line contains field to define a specific error message.
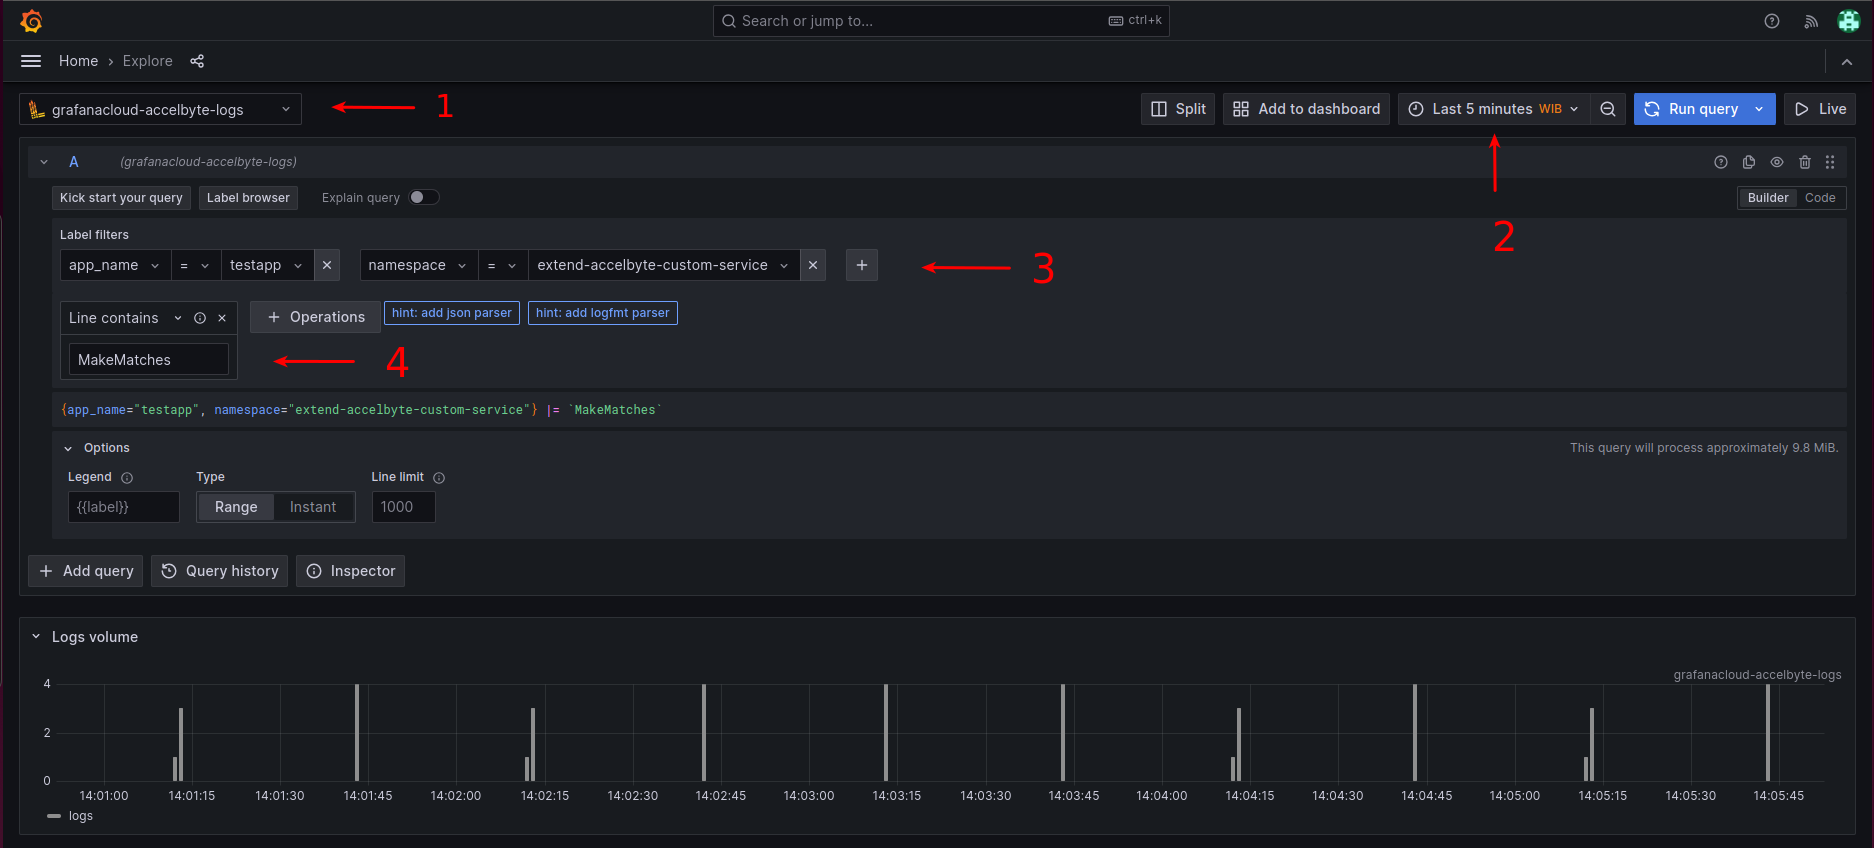
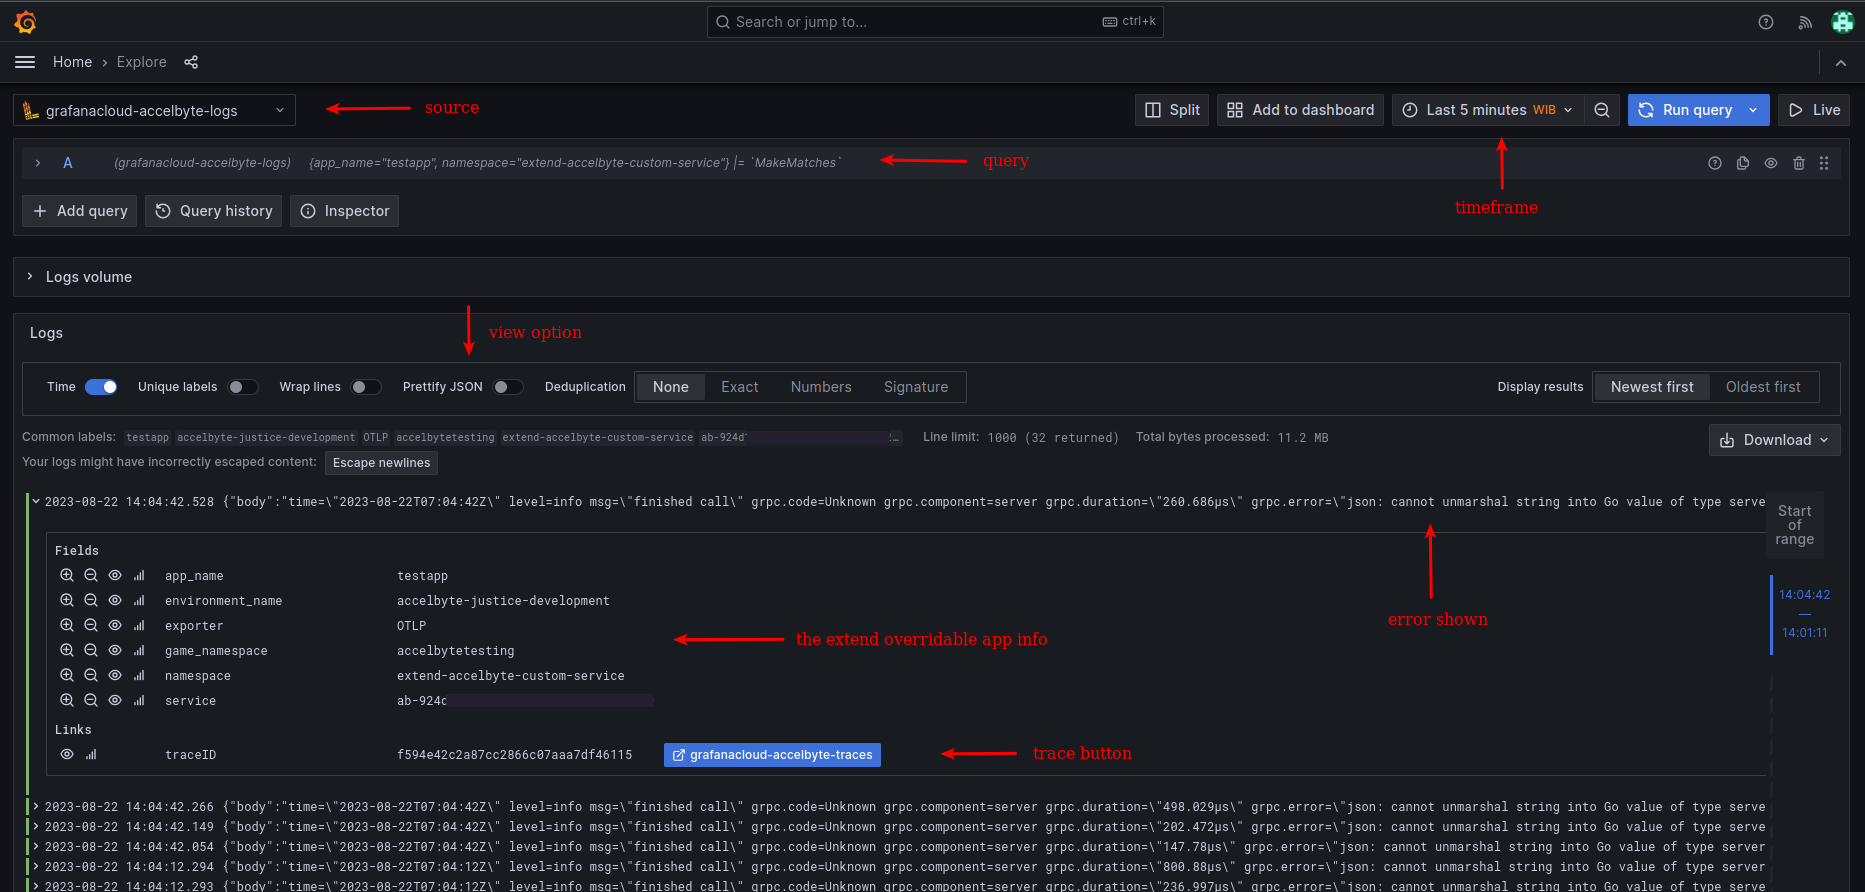
Following the image below, start by selecting the source (1). Then, select the time frame to query (2). For simplicity, filter the logs by "app_name" and "namespace" (3). Lastly, append the Line contains criteria to isolate specific errors (4). The logs will be visible upon clicking the Run query button.
The image below demonstrates the result of the example debugging. The logs will be presented as depicted above (with the query and logs volume section minimized). Additionally, the Extended Override app info and the displayed error will be accessible to assist in the debugging process. Grafana also provides a viewing feature that allows logs to be prettified or lines to be wrapped by toggling the Prettify JSON or Wrap lines options, if needed.
Lastly, there is a trace button located adjacent to the "traceID" that can be clicked to access the source of the trace for more detailed information.
Work with metrics
- To initiate work with metrics, select the source.
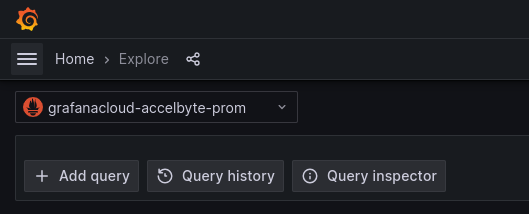
- Include or remove multiple queries as required. With the source selected, click the Add query button. Additionally, Grafana can also display the query history through the Query history button.
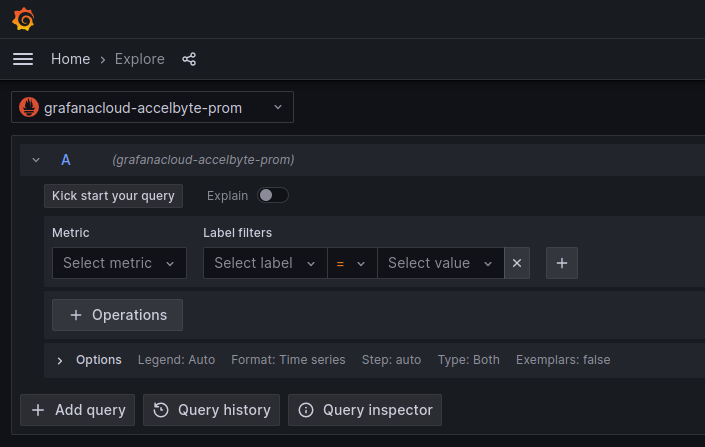
- Choose the dropdown for label filters and the corresponding value to filter the metrics. Adjust labels as needed and use the Line contains field to define a specific metrics data.
Following the image below, start by selecting the source (1). Then, select the time frame to query (2). Choose the values in the Metric dropdown and Label filters (3). Lastly, append more Label filters to isolate a specific "app_name" for the Extend Override app (4). The metrics will be visible upon clicking the Run query button.
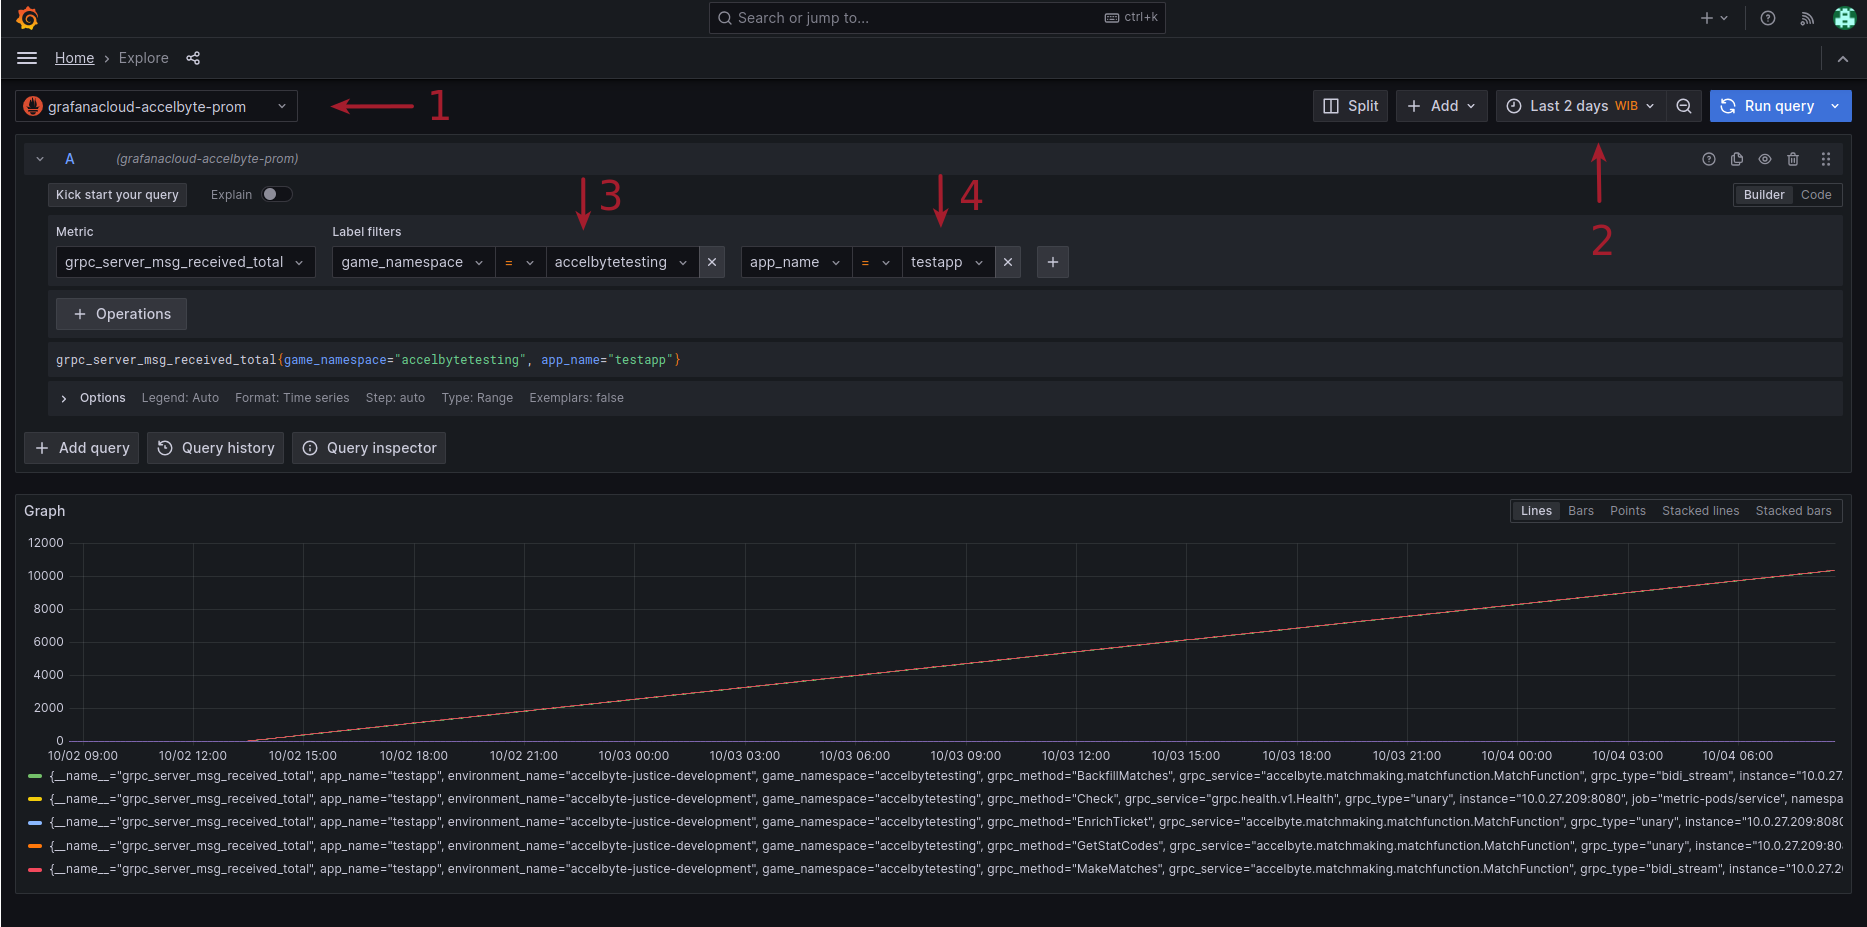
There are numerous pieces of data containing metrics from AGS and the Extend Override app itself. One way to sum up the metrics is to go the Metric Dashboard.
Metrics dashboard
The dashboard will be updated over time.
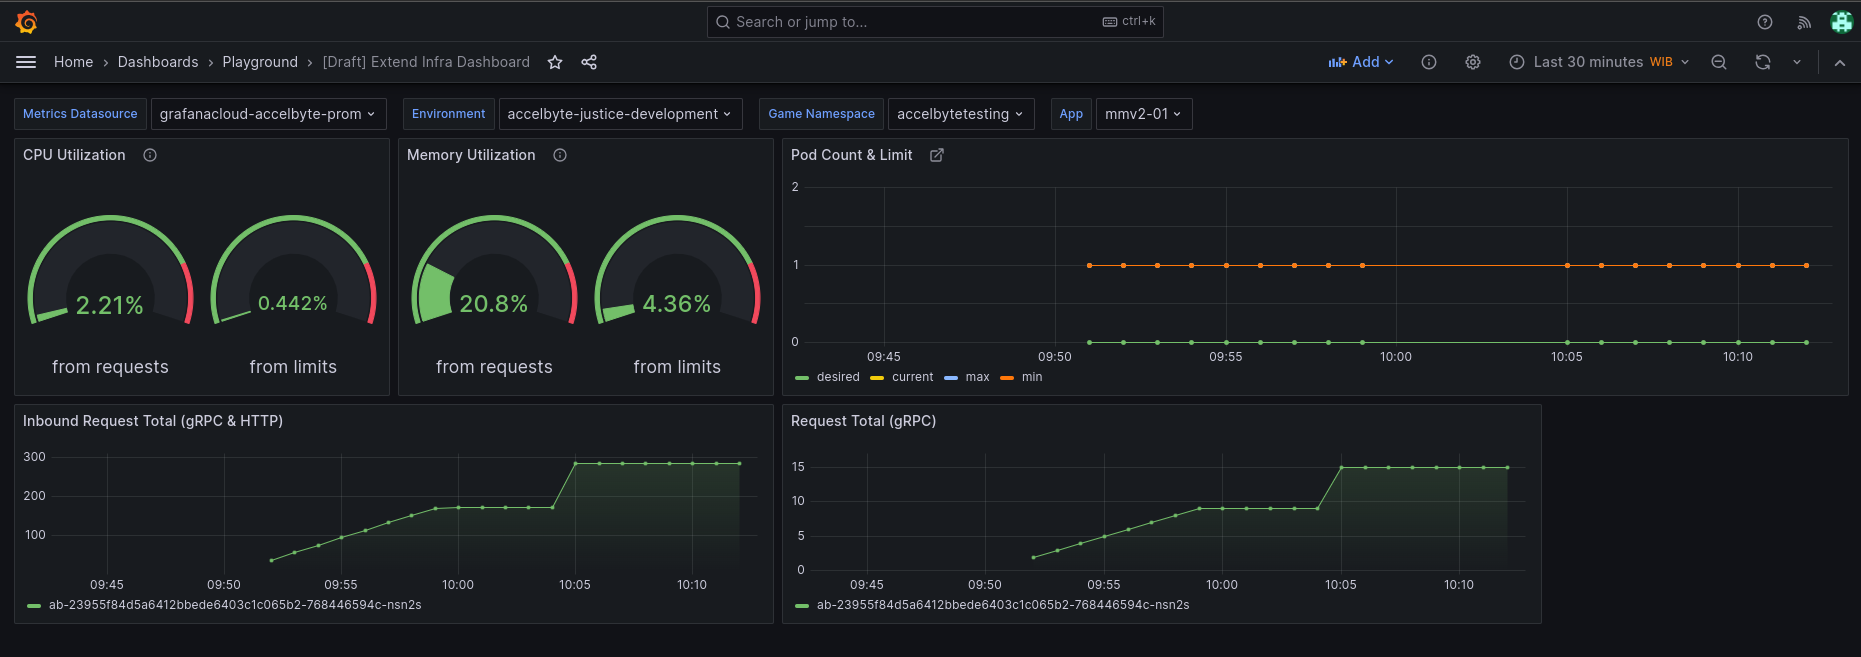
In the dashboard, there are sections for CPU Utilization and Memory Utilization, each displaying data from requests and from limits. Additionally, the dashboard includes an Inbound Request Total for both gRPC and HTTP, complete with their trace IDs.
The Inbound Request Total (gRPC & HTTP) and Request Total (gRPC) will show the total number of requests for the Extend Override app (ab-12345), categorized by either gRPC or HTTP requests.
