Game standard events dashboard
Overview
The Game Standard Events dashboards are a collection of dashboards driven by game standard event telemetry from the Game SDK. These dashboards give title-specific insights on player engagement, progression, and in-game economy. They also aid developers with balancing decisions and evaluating the effects of changes.
Missions
The Missions dashboard tracks how players engage with and complete tasks or quests within the game.
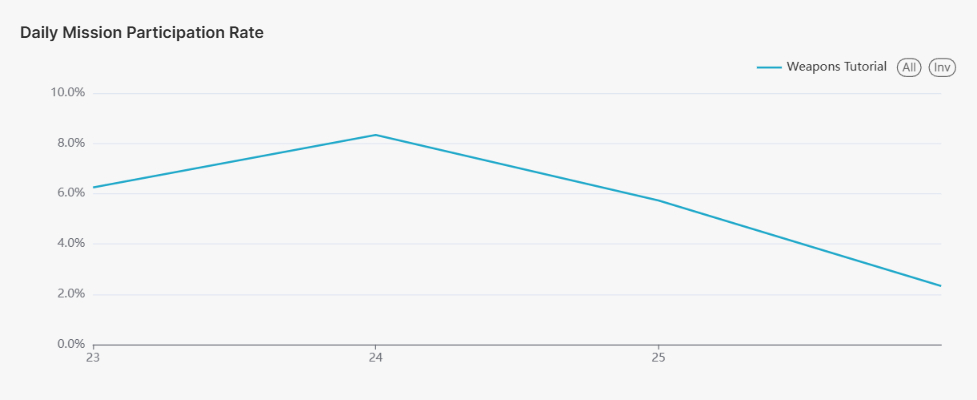
The Daily Mission Participation Rate chart shows the percentage of daily active users participating in a particular mission.
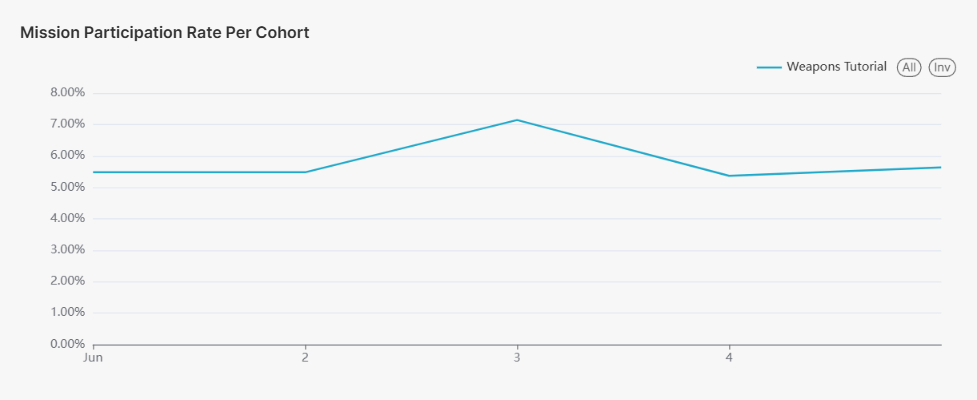
The Mission Participation Rate Per Cohort chart shows what percentage of each user cohort has completed a mission.
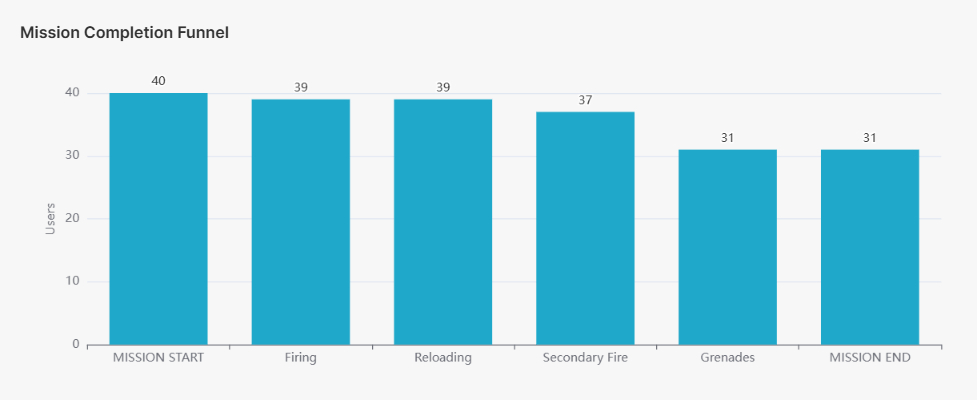
The Mission Completion Funnel allows for easy identification of where players are abandoning a mission at each step.
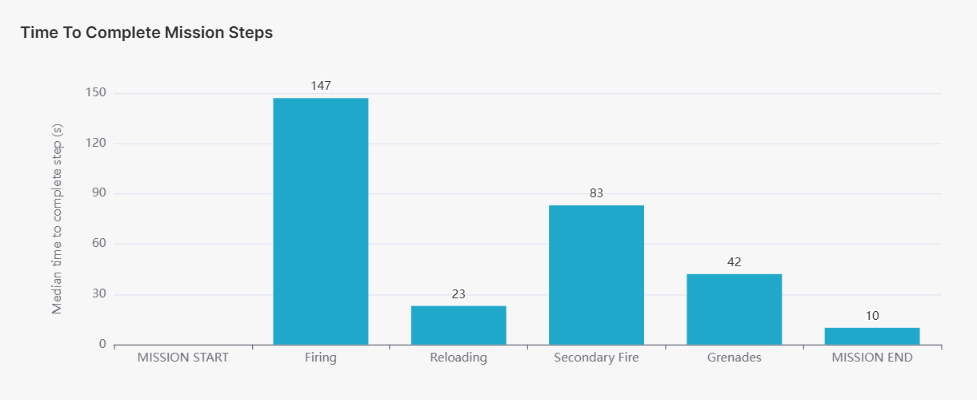
Time to Complete Mission Steps shows the time taken at each step of a mission. This can help identify steps where pacing, challenge or level of guidance could be improved.
Matchinfo
The Matchinfo dashboard tracks the participation of match-based content, their duration, as well as player win rates.
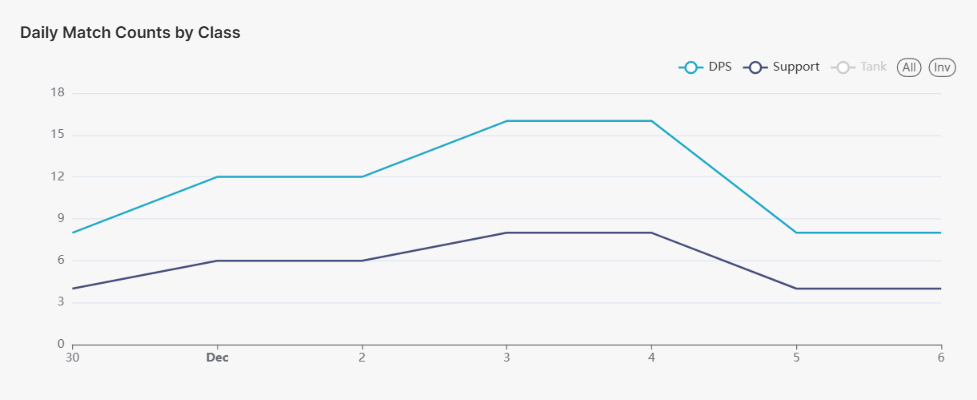
The Daily Match Counts chart displays the total number of matches played. This data can be further aggregated by Game Mode, Difficulty, Class, and Rank.
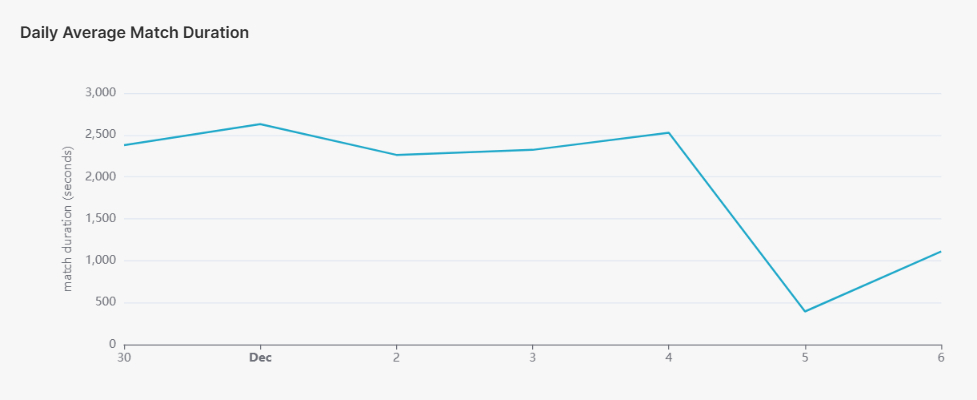
The average amount of time players spend in matches each day is displayed in the Daily Average Match Duration chart. This data can also be filtered by specific game modes. These can be used in conjunction with match count data for determining rewards based on time spent within match activities.
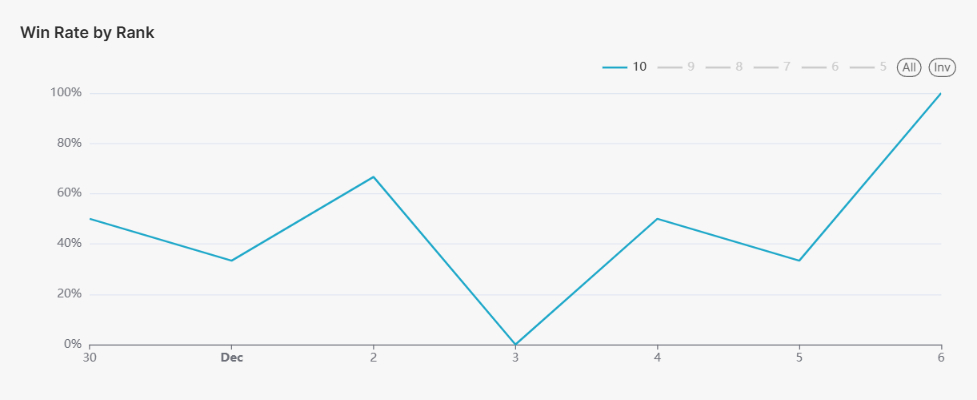
Win Rate charts display the proportion of matches participated by a character class or player of a specific rank results in victory.
Pop-ups
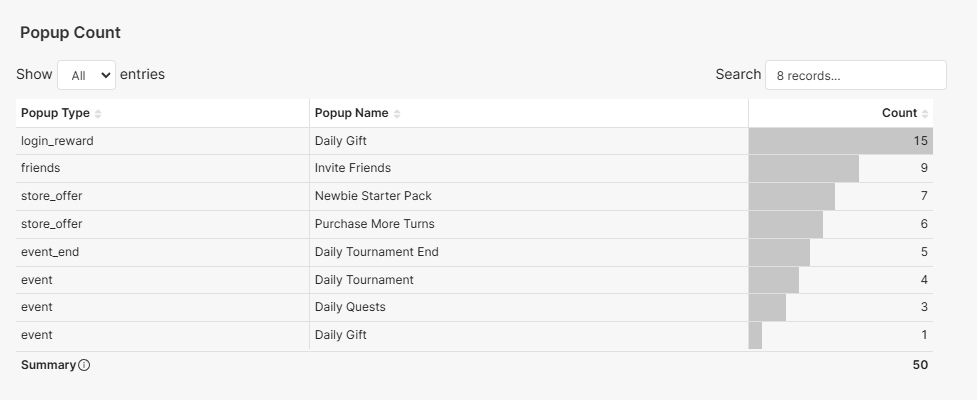
Popups can be tutorial prompts, promotions, errors, and other messages that are displayed to users. Use the Popups dashboard for insights into how often a type of popup appears.
The dashboard offers a searchable table of popup counts by appearances, grouped by their type and name.
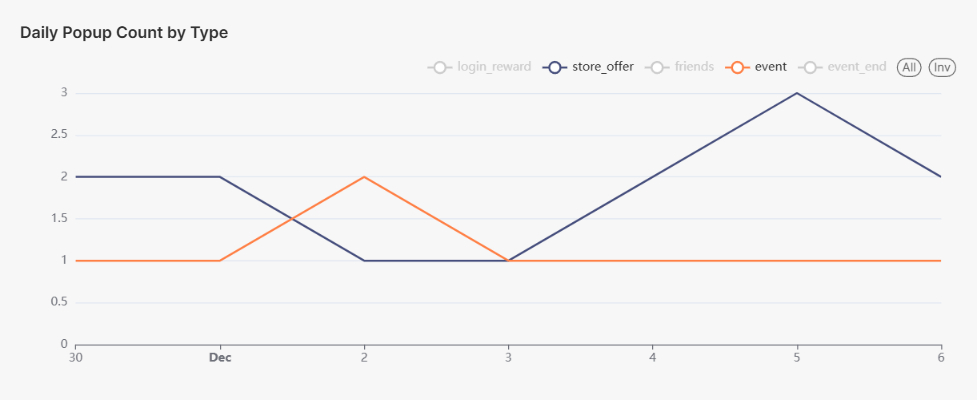
The data can also be viewed as a daily aggregate.
Leveling
The Level Distribution chart displays the distribution of the most recently achieved level brackets for each entity or player within the specified timeframe. The brackets are sorted left to right based on the number of entities they contain, with the bracket containing the highest number of entities positioned furthest to the left.
The term "level" can be used interchangeably with other stats sent through the game standard event, such as PVP level, account level, etc.

Deaths
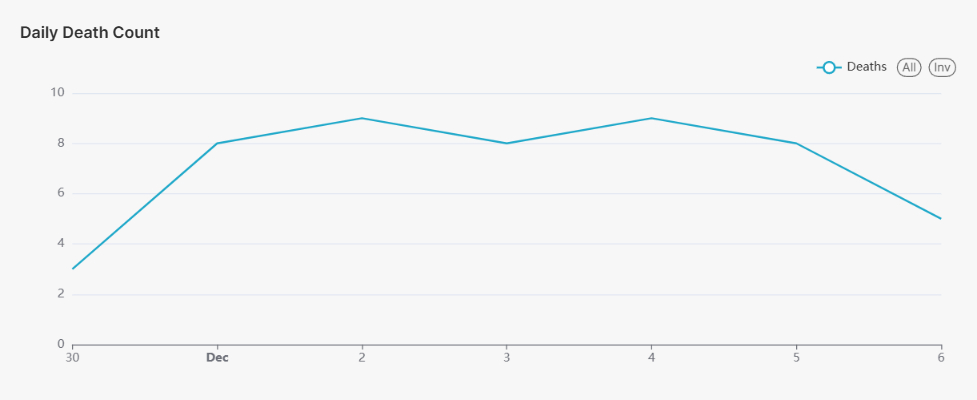
The Deaths dashboard displays the number of deaths each day that occur to the filtered entity type. The data is also available aggregated by location, type and source.

Resource flow
The Resource Flow dashboard provides developers with insights into the overall state of the in-game economy. This helps them to make informed balancing decisions and validate the impact of those changes over time.
Note that only active players, who have interacted with a specific resource on a given date, are included in these charts.
Resources Used chart provides a daily summary of gross resources used.
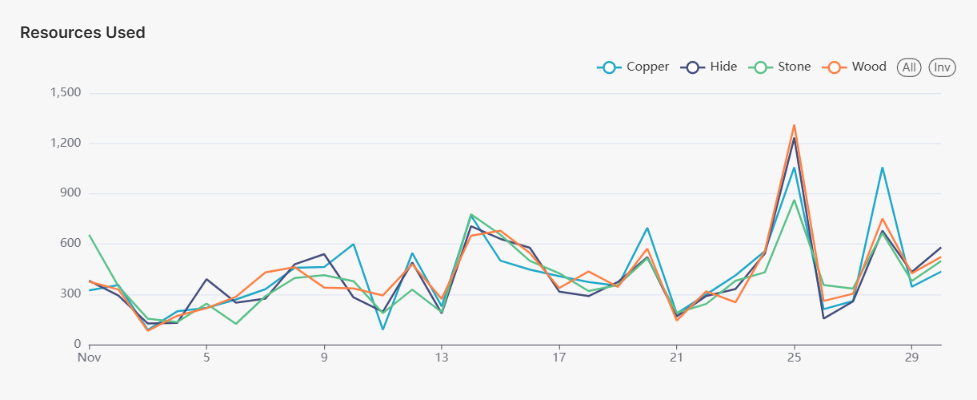
The remaining charts in this dashboard show detailed data for the resource selected in the Resource filter.
The Acquisition and Consumption Flow chart give an overview of a resource through the following metrics:
- Inventory Sum: total end of day balance of players — an indicator of trends in excess or shortage in the economy.
- Average Inventory Per User: the Inventory Sum divided by the number of users interacting with the resource.
- Source Sum and Sink Sum are the total inflow and outflow, respectively.
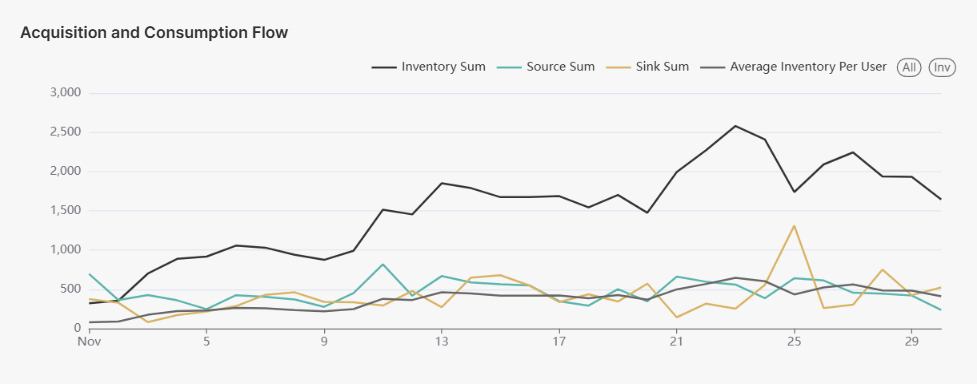
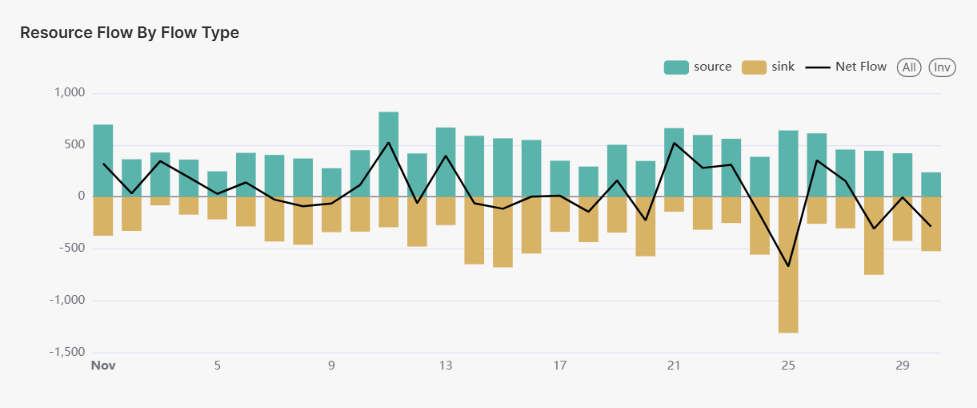
The Resource Flow by Flow Type chart shows the same source and sink information as in the Acquisition and Consumption Flow chart, summarised by a Net Flow metric. Net Flow is the balance of sources and sinks each day, and reveals whether there is a positive or negative trend.
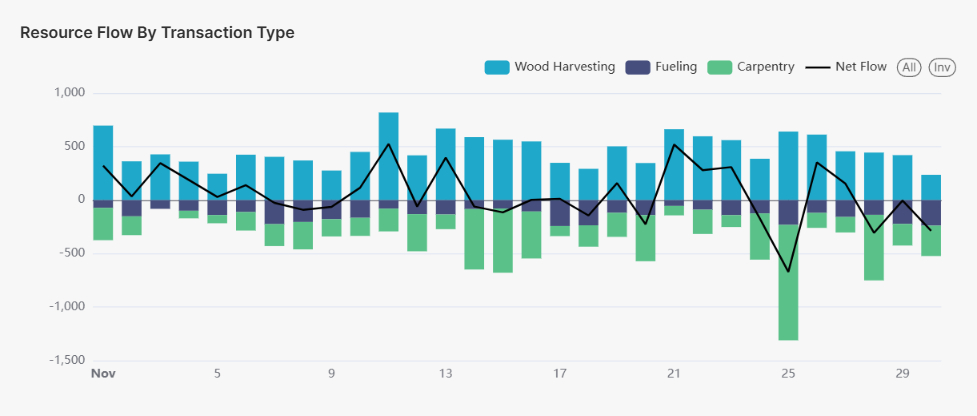
The Resource Flow By Transaction Type chart shows how specific systems or activities (represented by bars) in the game contribute to the Net Flow. This chart is useful for identifying specific systems which may require actionable adjustments. It may also reveal the economic impact caused by changes in other areas of the game.
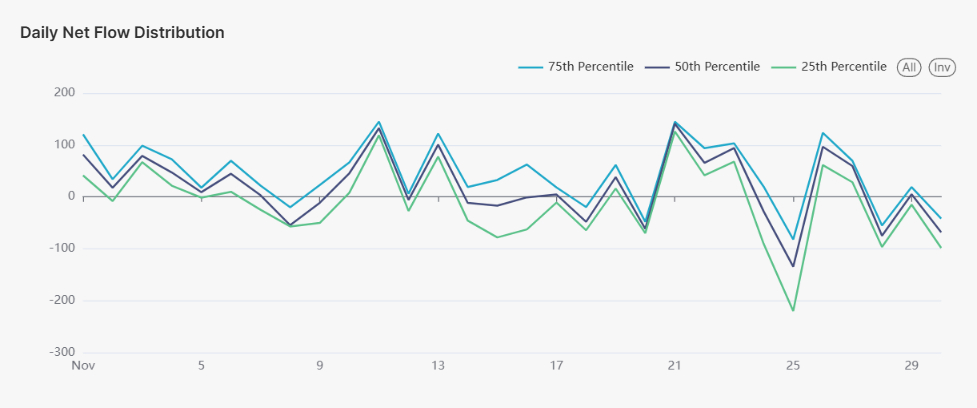
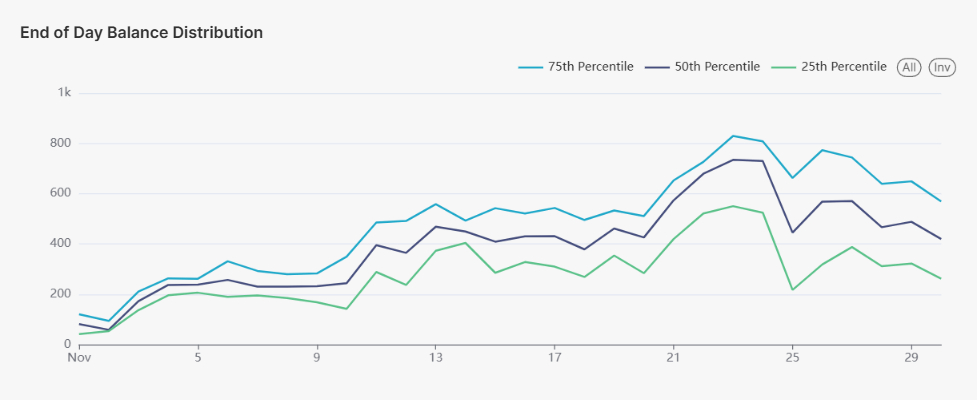
The Daily Net Flow Distribution and End of Day Balance Distribution charts aggregate Net Flow and Inventory Sum by the 25th, 50th, and 75th percentile. This helps determine if the situation with each metric is typical of the average user or specific segments.
