Java Extendアプリでのメモリ不足の問題
Overview
Java Extend app uses a garbage collector to automatically manage system memory. However, memory issues may still occur due to:
- Inefficient data structures
- Holding references onto large objects for far longer than necessary
- Memory leaks
- General high memory usage
Best practices
- Choose the right data structure for your needs, e.g., use Hashmap over TreeMap when sorting isn't required. For ArrayList, if you know the expected size, specify it during creation to minimize resizing operations that may be costly.
- Avoid String concatenation since it's immutable. Use
StringBuilderinstead. - Remove objects from collections as soon as they are no longer required, especially large objects.
- Incorporate CPU and memory profiling into your development cycle to catch memory leaks and performance bottlenecks early.
- Optimize garbage collection and heap size. Tune the garbage collection and heap size based on your performance goals. Tuning the heap size for the initial and max heap (
-Xms/Xmx) prevents resizing during runtime. Set the heap size to be large enough to reduce the excessive garbage collection activity. - Minimize object creation or reuse objects whenever possible. Consider using pools for expensive objects that are frequently created and destroyed.
- Leverage lazy initialization to delay creation until it's needed to reduce initial memory consumption and improve startup time.
- Limit the amount of data retrieved from other sources.
- Avoid using native code as it often requires manual memory management which bypasses the Java virtual machine's (JVM) memory management. Incorrect usage of native code can also lead to memory leaks, crashes, and unexpected behaviors. When using native code, carefully manage native resources to ensure they are properly released.
Recommended tools
To manage your CPU and memory usage, we recommend using the following tools:
IntelliJ Profiler
IntelliJ Profiler is a performance analysis tool with a range of profiling features designed to optimize code by analyzing CPU and memory usage. To integrate Intellij with your Extend app, follow these steps:
- Start the Extend application in IntelliJ by selecting Profile with IntelliJ Profiler.
- Run your application under Run > Profile [your application name] with IntelliJ Profiler.
- When the profiling is complete, click Stop Recording and Show Results. The CPU sampling - Flame Graph result appears.
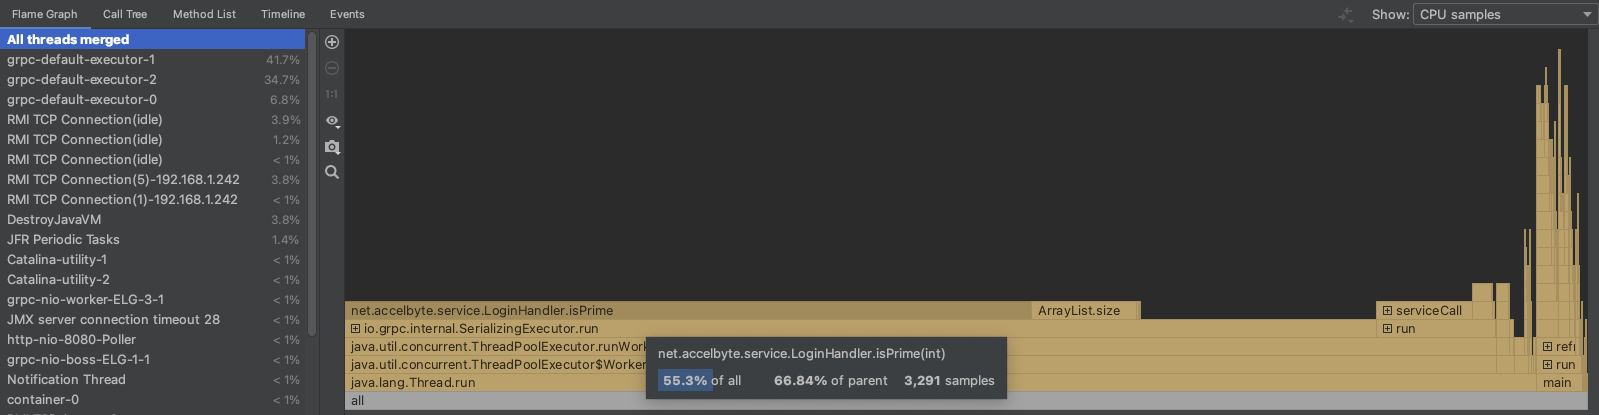
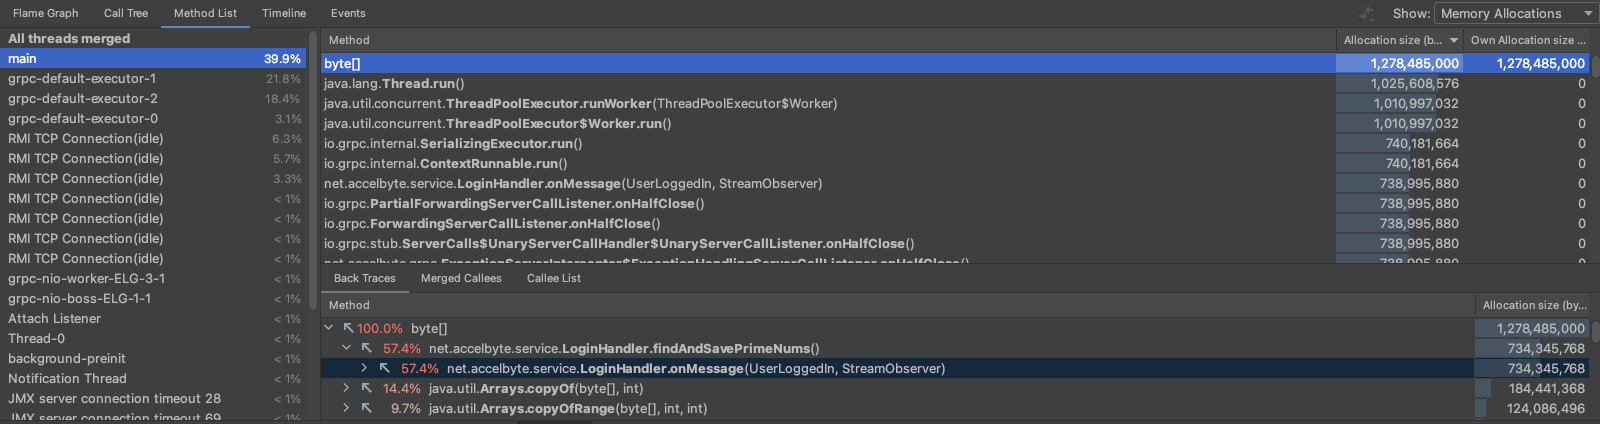
- Switch the results view between CPU samples and Memory samples. The following image shows the results in the Memory samples view.
For more information, refer to IntelliJ Profiler's documentation on CPU profiling and on finding memory leaks.
IntelliJ Profiler with VisualVM
You can use the IntelliJ Profiler with VisualVM to retrieve live results from Java Management Extensions (JMX) and from saved Java Flight Recorder (JFR) files. Follow these steps:
- In VisualVM, select the running application under Local and double-click on the application to connect. When connecting live, VisualVM shows the live monitoring results of the CPU and Memory usage.
- You can then proceed to:
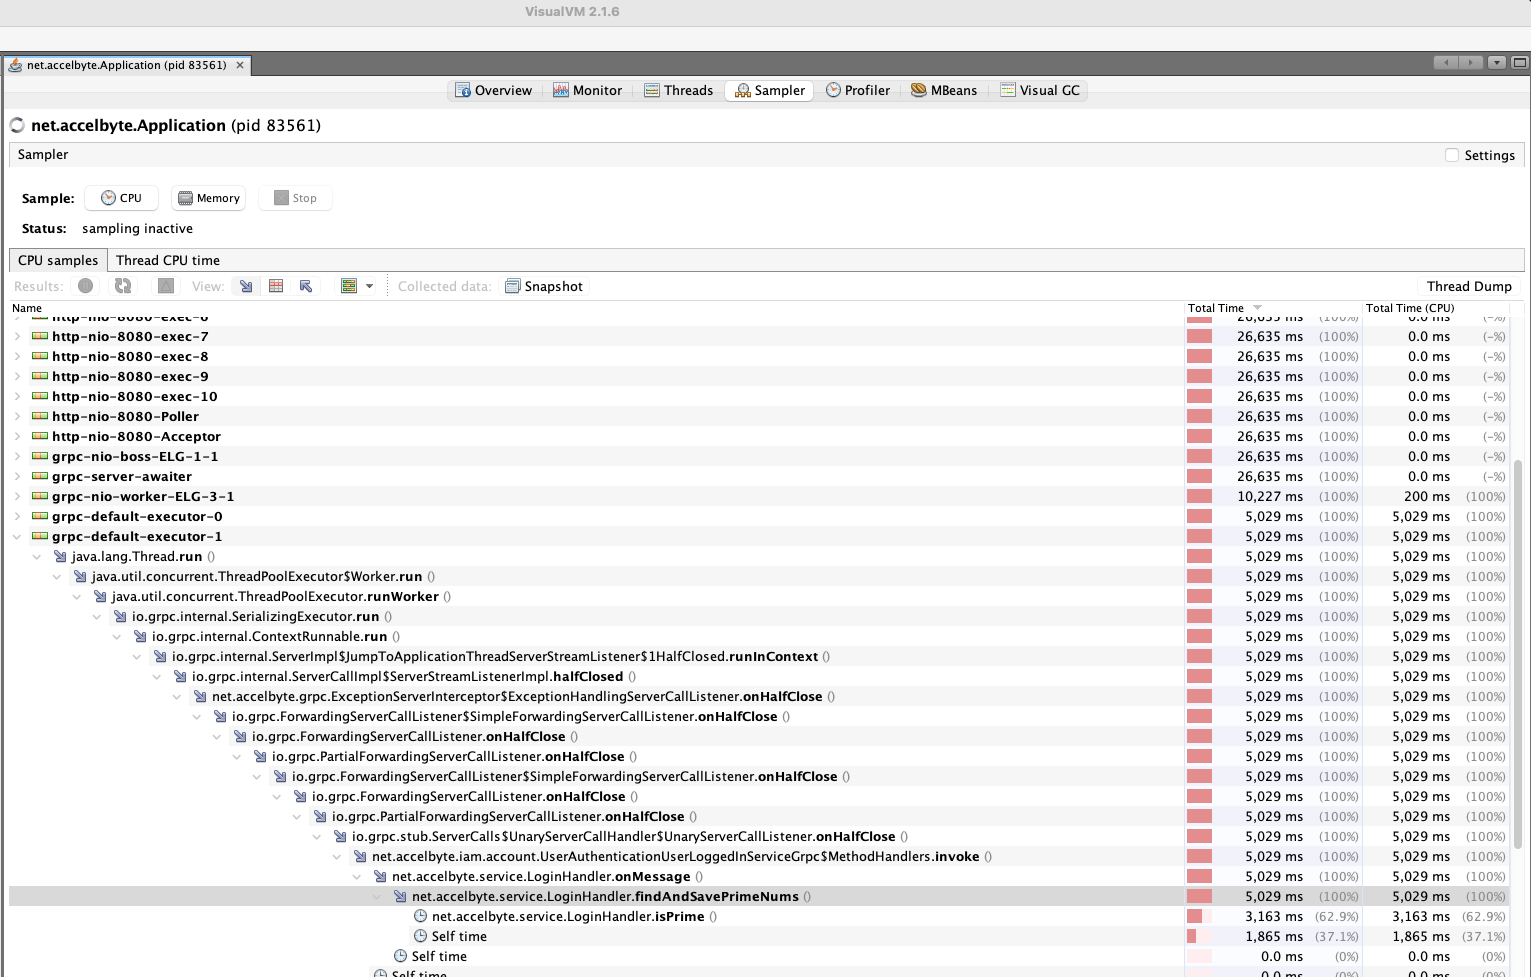
- Go to the Sampler tab to start sampling the CPU and memory.
- CPU samples
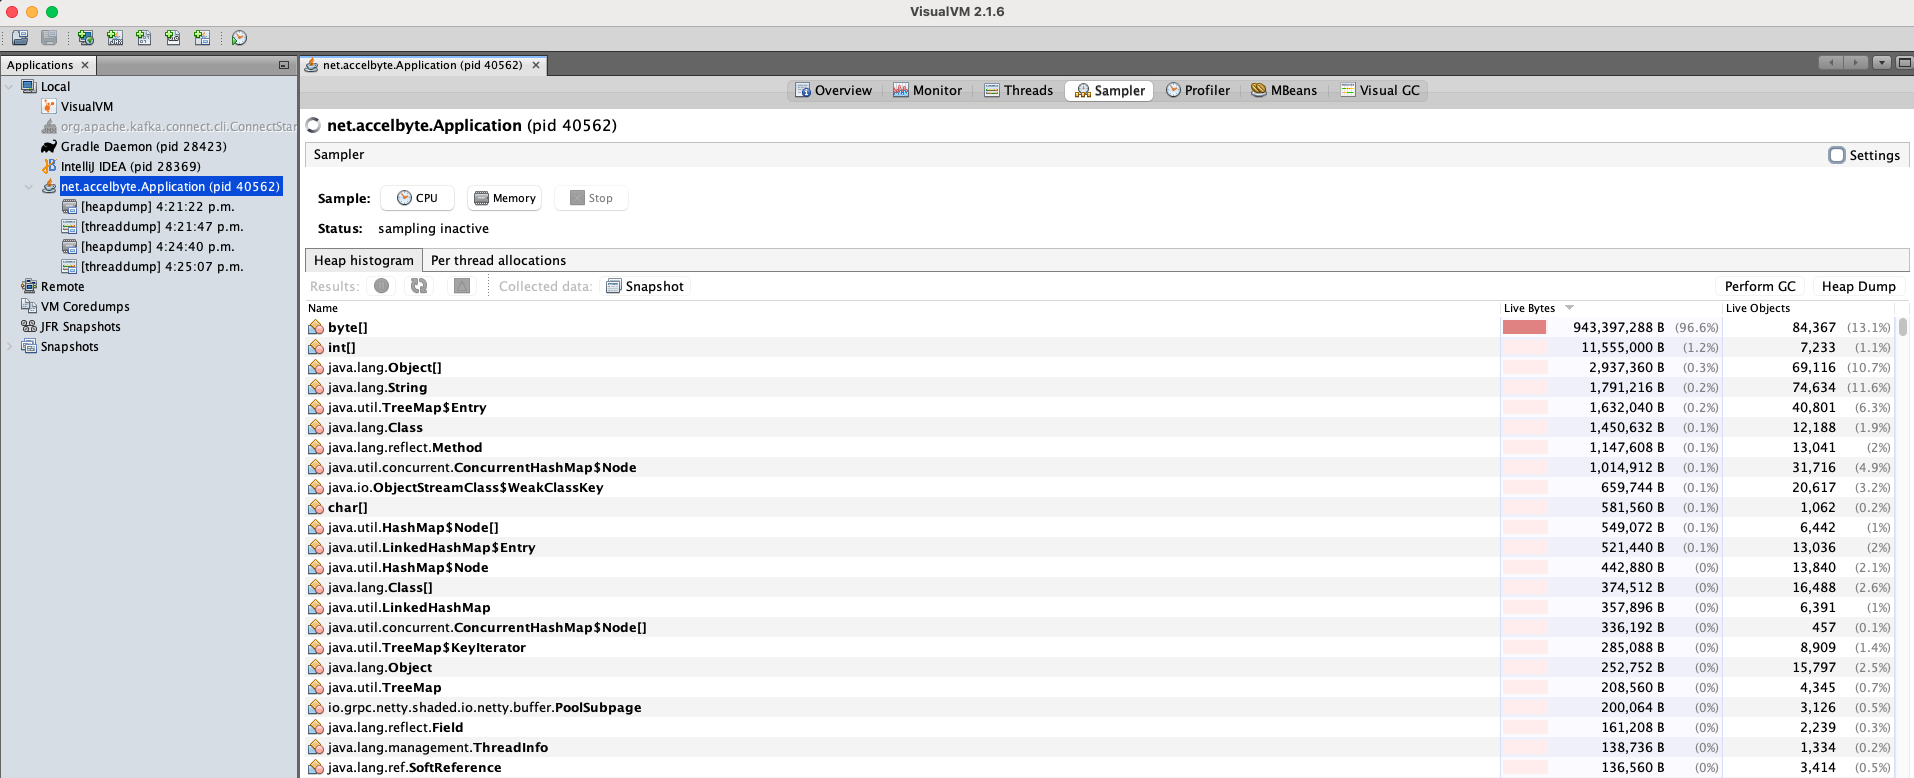
- Memory samples
- CPU samples
- Go to the Profiler tab to find the memory usage of the objects all the way from to source method.
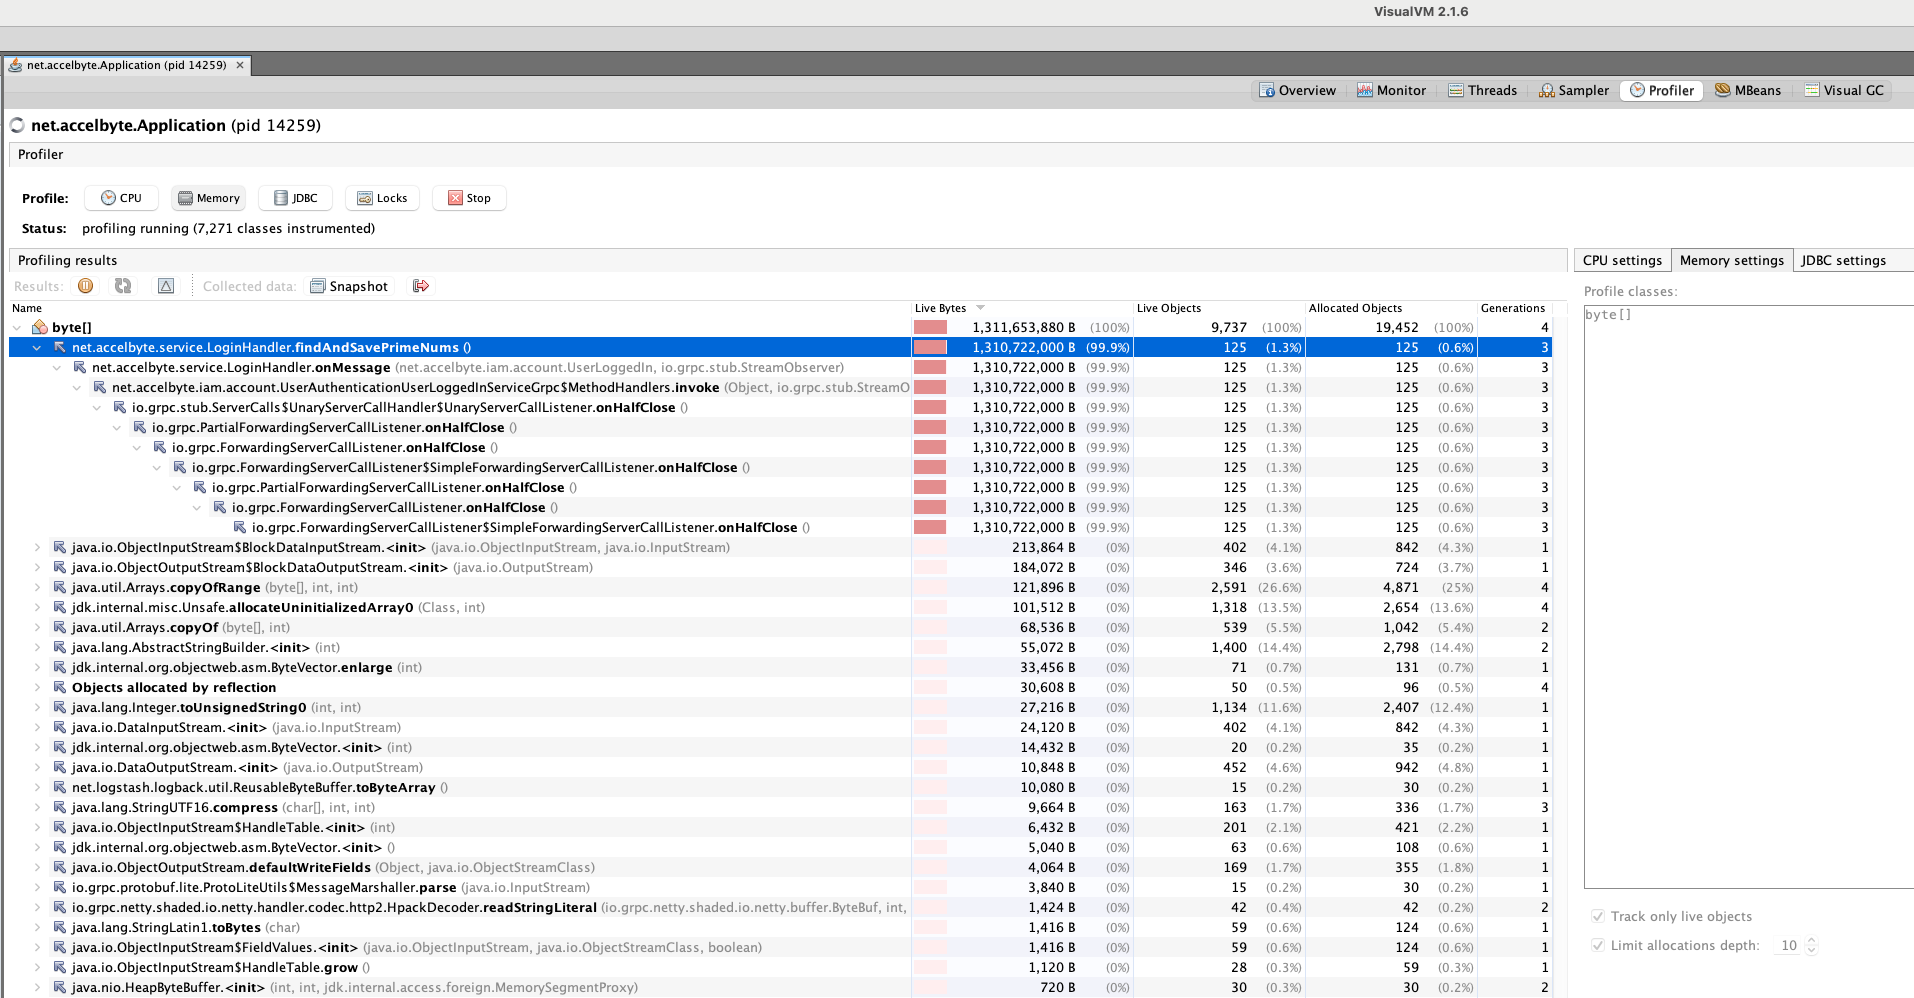
For more information, refer to VisualVM's documentation.
Docker Container
Depending on the build and version of your JVM, some features may not be supported (e.g., the ibm-semeru-runtimes:open-17-jre build may have heap dumping disabled). For more information about Docker's supported features, refer to Docker Container's documentation.
To use Docker Container for your Java Extend app, follow these steps:
- Open up a JMX connection for remote monitoring.
- Enable the JMX connection via JVM arguments. For our event-handler app template, you can enable the JMX connection via the
JAVA_OPTSenvironment variable fromdocker-compose.yaml.- JAVA_OPTS=-Dcom.sun.management.jmxremote=true -Dcom.sun.management.jmxremote.port=9010 -Dcom.sun.management.jmxremote.rmi.port=9010 -Dcom.sun.management.jmxremote.local.only=false -Dcom.sun.management.jmxremote.authenticate=false -Dcom.sun.management.jmxremote.ssl=false -Djava.rmi.server.hostname=127.0.0.1 - Make sure to expose the JMX port, for example, add
- "9010:9010"todocker-compose.yamlunder Ports.
- Enable the JMX connection via JVM arguments. For our event-handler app template, you can enable the JMX connection via the
- Start the application using docker compose.
- Open VisualVM, then add the new JMX Connection and enter the address (e.g.,
localhost:9010for the exposed JMX port configured in step 1).
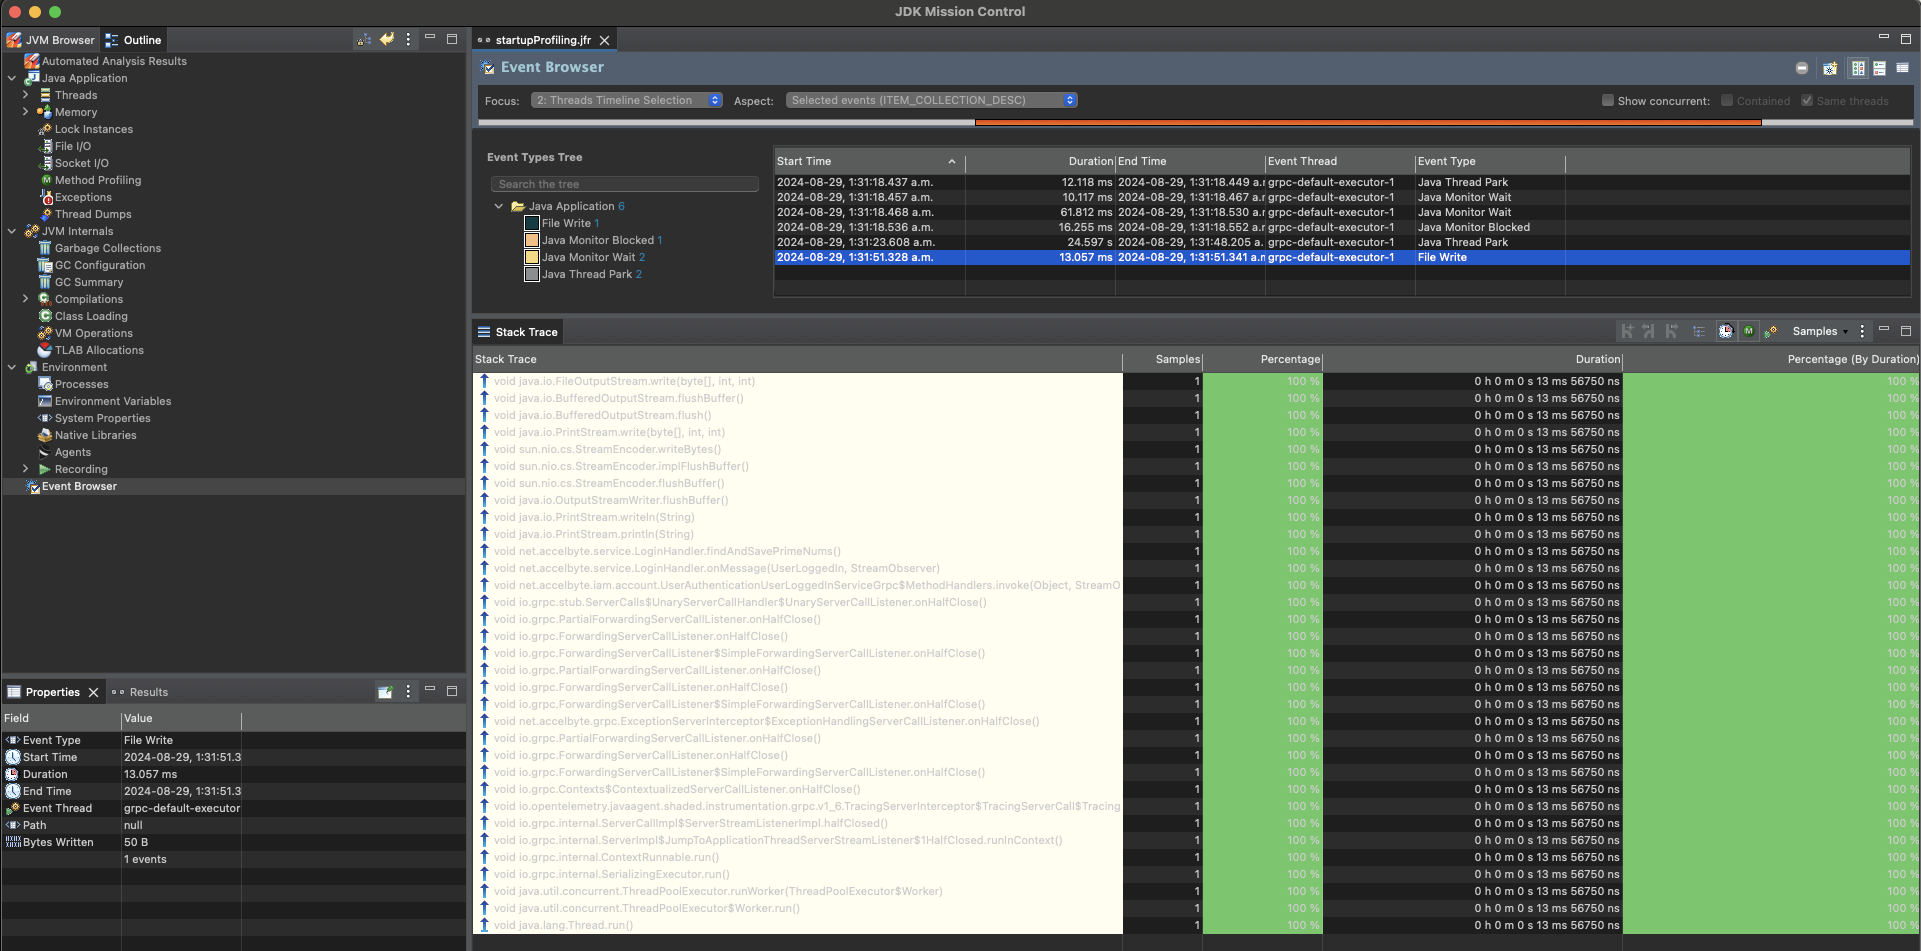
Java Flight Recorder (JFR) and JDK Mission Control (JMC)
Java Flight Recorder (JFR) and JDK Mission Control (JMC) help you collect diagnostic data, including event logs all the way from the application startup. For more information about these tools, refer to Oracle's JFR Runtime Guide.
Double-check your JDK distribution for commercial licensing usage.
To use JFR and JDK for your Java Extend app, follow these steps:
Open up a JMX connection for remote monitoring.
- Enable the JMX connection via JVM arguments. For our event-handler app template, you can enable the JMX connection via the
JAVA_OPTSenvironment variable fromdocker-compose.yaml.- JAVA_OPTS=-Dcom.sun.management.jmxremote=true -Dcom.sun.management.jmxremote.port=9010 -Dcom.sun.management.jmxremote.rmi.port=9010 -Dcom.sun.management.jmxremote.local.only=false -Dcom.sun.management.jmxremote.authenticate=false -Dcom.sun.management.jmxremote.ssl=false -Djava.rmi.server.hostname=127.0.0.1 - To automatically capture a 60-second recording with JFR when starting your Java extend application, set the following environment variable:
- JAVA_OPTS=-XX:StartFlightRecording=filename=/tmp/startupProfiling.jfr,duration=60s,settings=profile - Make sure to expose the JMX port, for example, add
- "9010:9010"todocker-compose.yamlunder Ports.
- Enable the JMX connection via JVM arguments. For our event-handler app template, you can enable the JMX connection via the
Open JMC and locate the generated JFR file. If the JFR file isn't local, you can copy from the Docker container.
Start your analysis. Optionally, you can also instruct JFR to start and stop flight recording on demand.
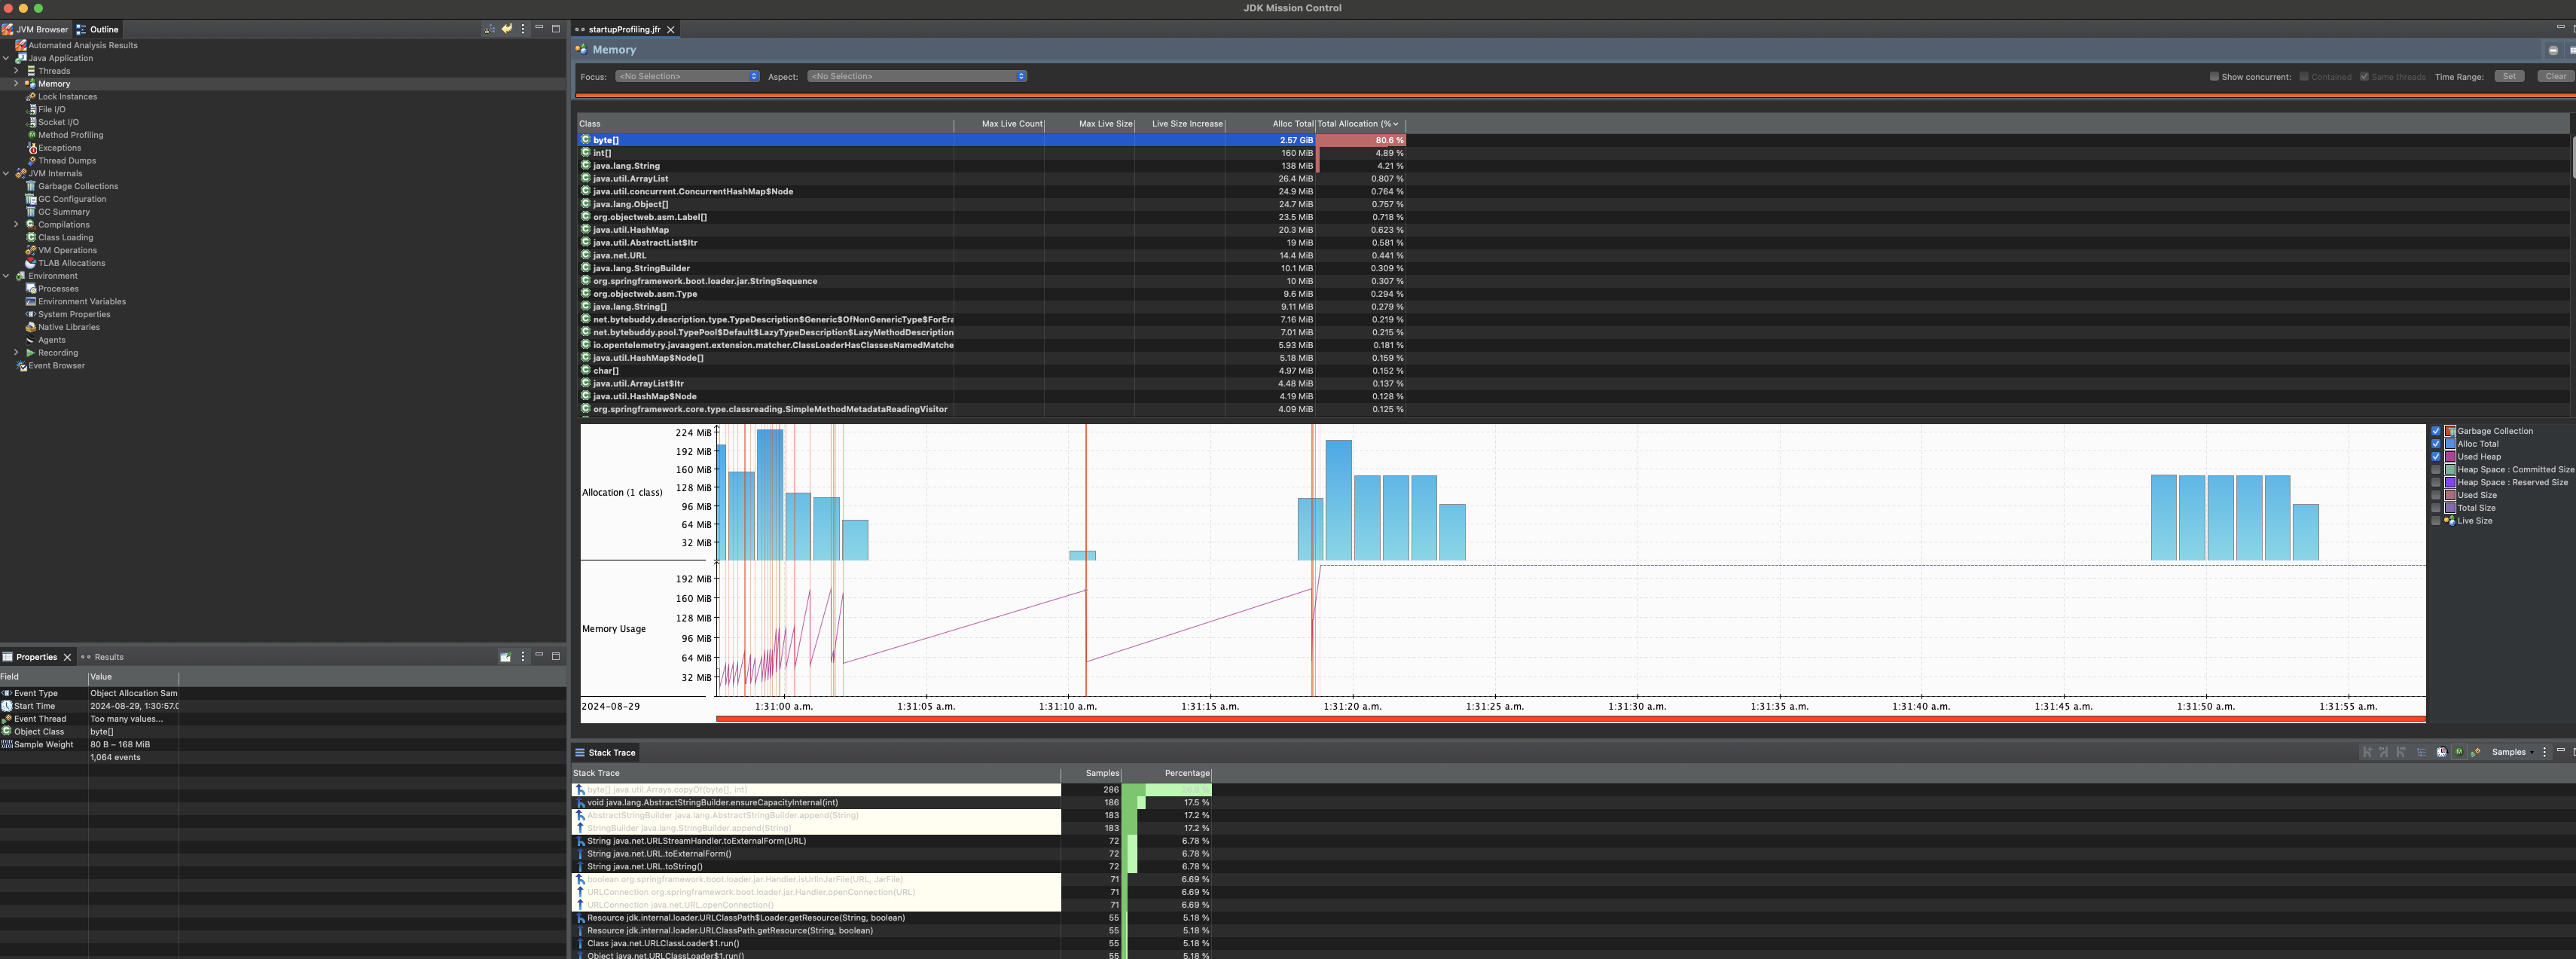
Sample results for Memory
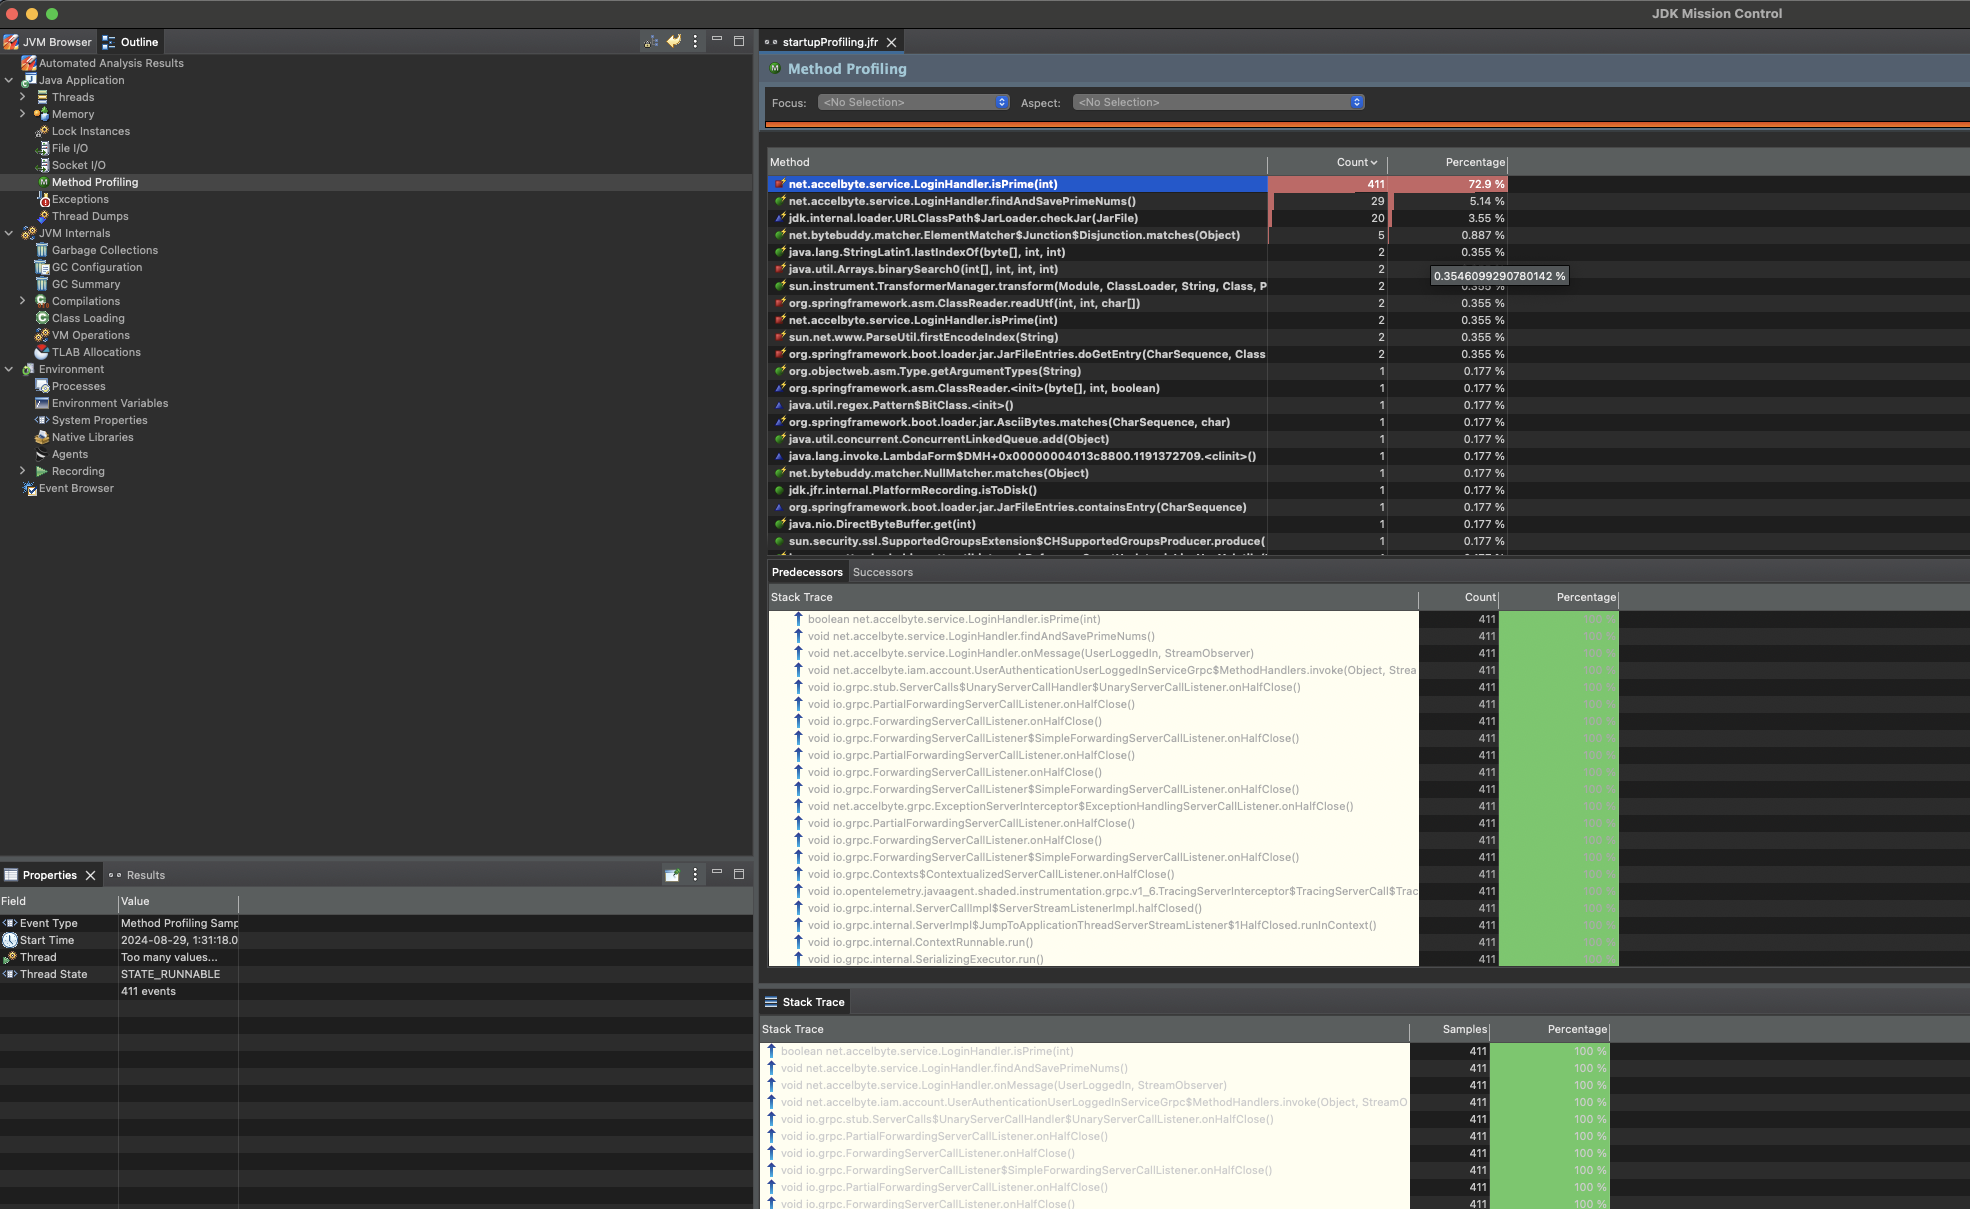
Sample results for Method Profiling
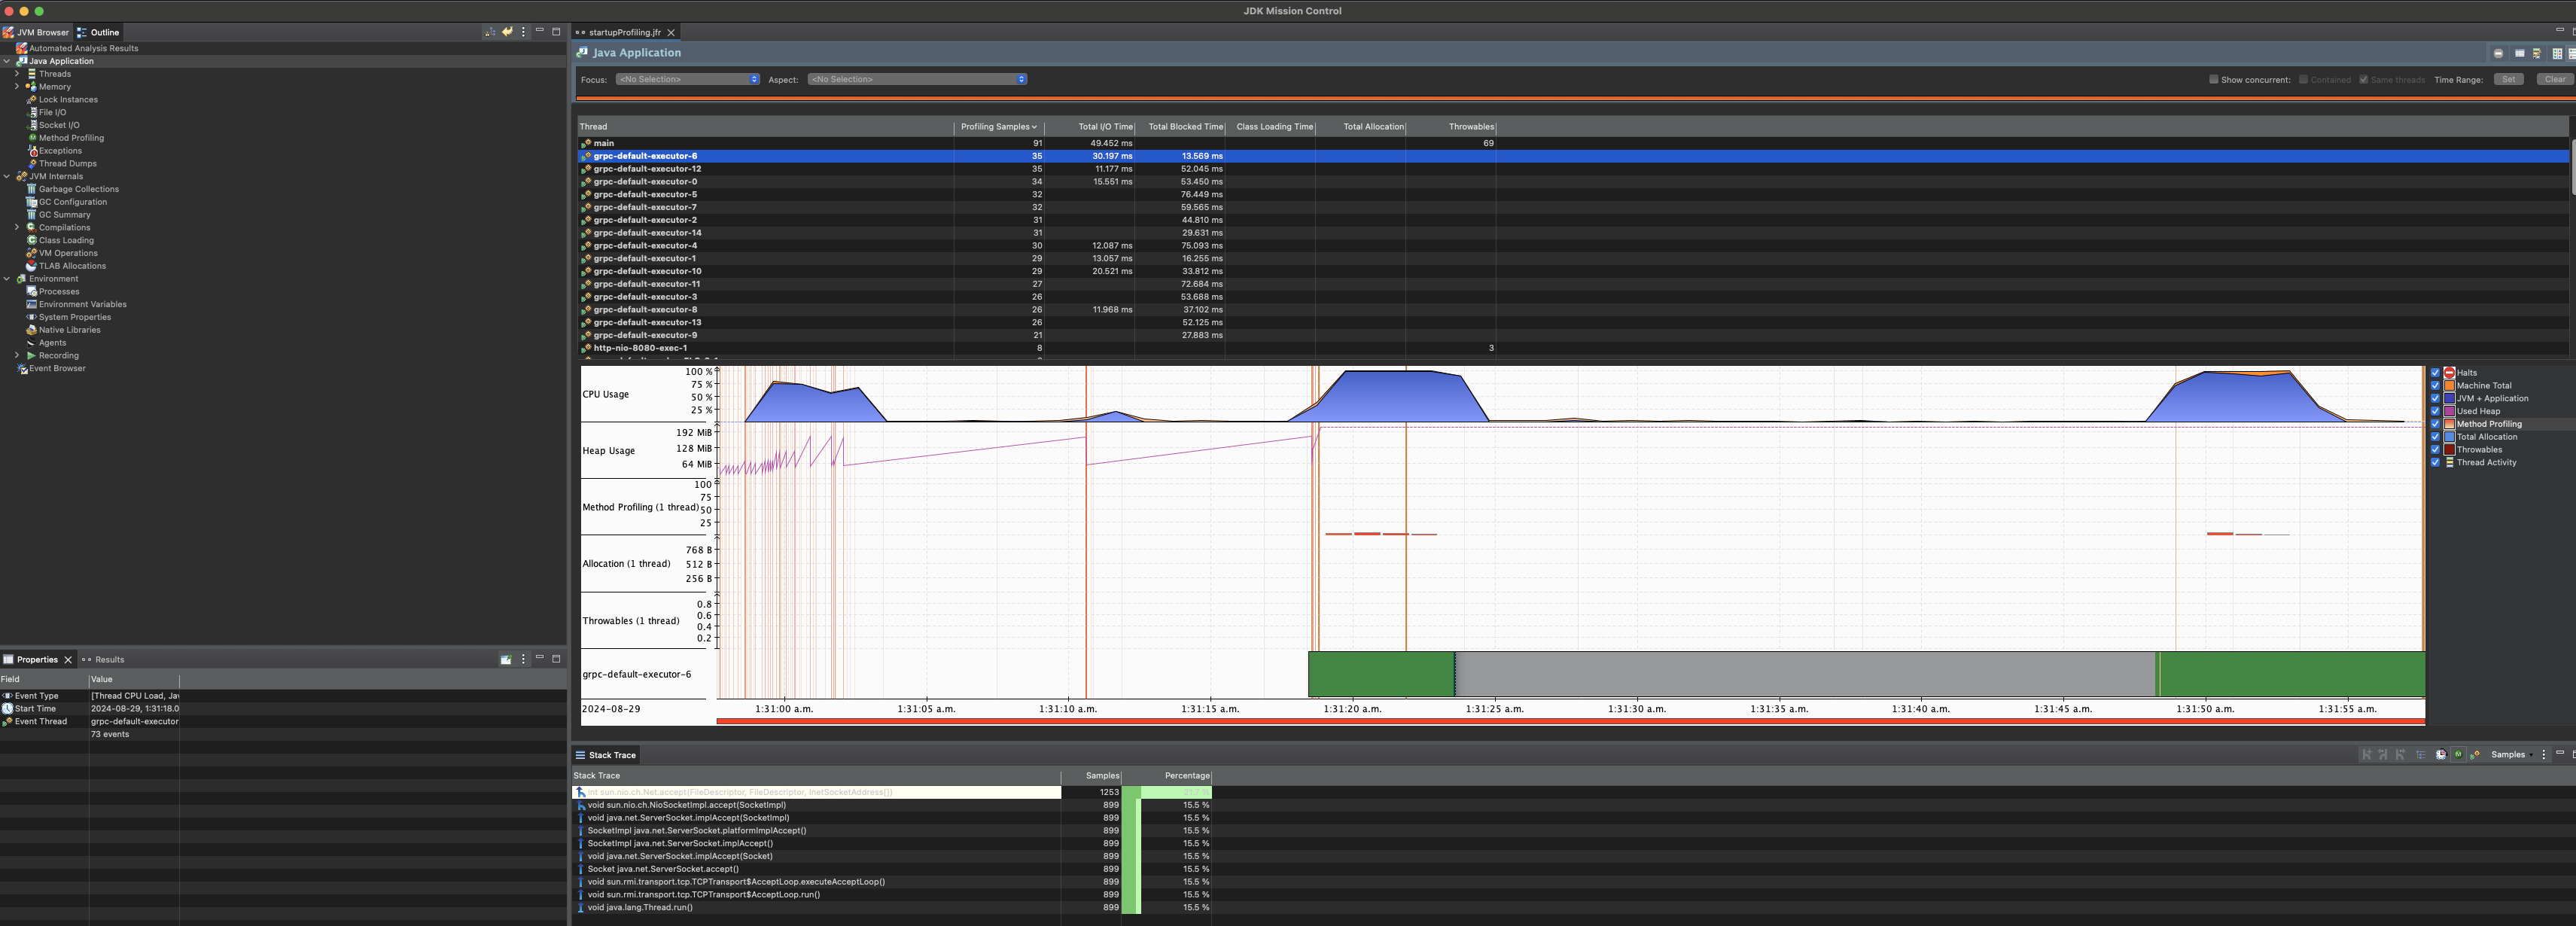
Sample results for Thread CPU Load under Event Types Tree
References
We recommend reading the following articles from Oracle's troubleshooting guide:
- General Troubleshooting
- Debug JVM Issues (Troubleshoot System Crashes or Hangs and Exceptions)