Analyze dedicated server crashes (Beta)
Server Crashes is in closed Beta and is available on AccelByte Gaming Services (AGS) Public Cloud only. It is not enabled by default: AccelByte enables it for each game namespace on request. To request access, contact us. Features, fields, and limits may change before general availability.
Overview
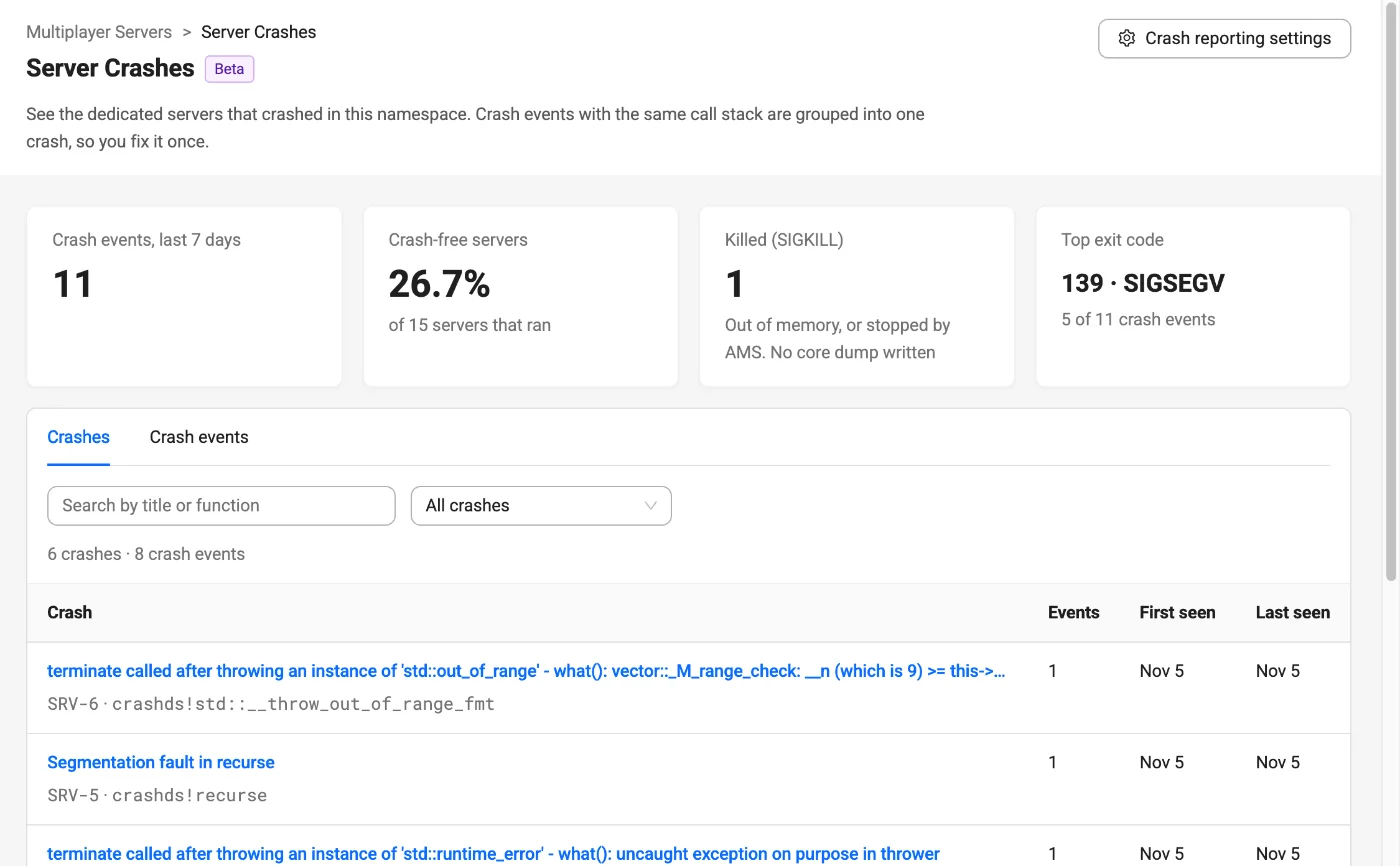
When a dedicated server (DS) in an AccelByte Multiplayer Servers (AMS) fleet crashes, AMS replaces it so that players can continue to be matched to available servers. The Server Crashes feature in the AGS Admin Portal records each crash and provides the information required to identify its cause, including:
- Crash events: a record of every crashed server, including its exit code, fleet, region, image, and session.
- Call stacks: the sequence of function calls that led to each crash, with function names and line numbers when debug symbols are uploaded with the server image.
- Crash grouping: crash events that share the same call stack are grouped into a single crash, so that you can prioritize the issues that occur most frequently.
- Debug files: the core dump and server log of each crashed server, available for download.
- Crash metrics: crash events over time, the crash-free server rate, servers terminated due to insufficient memory, and the most frequent exit code.
Server Crashes does not require an SDK or a third-party crash reporter. AMS collects core dumps and logs directly from the virtual machine (VM) and processes each collected core dump into a call stack.
This article walks you through how to:
- Configure your server images and fleets for crash reporting.
- View and investigate crashes in the Admin Portal.
- Interpret the result of each crash event and resolve common issues.
How Server Crashes works
- A dedicated server exits with a non-zero exit code or is terminated by a signal, such as a segmentation fault (
SIGSEGV). AMS records the exit as a crash event. - If core dump collection is enabled for the fleet, AMS uploads the core dump and the server log from the VM. The upload typically completes within one to three minutes of the crash.
- AMS processes the core dump into a call stack, using the debug symbols uploaded with the server image.
- AMS adds the crash event to the existing crash that has the same call stack, or creates a new crash.
Exits initiated by AMS, such as session timeouts and the removal of unresponsive servers, are not recorded as crash events.
Prerequisites
- An active Multiplayer package for your game namespace.
- Server Crashes enabled for your game namespace. To request access during the closed Beta, contact us.
- A fleet running your dedicated server build on AMS. For more information, see Get Started with AMS.
- The AGS command-line interface (CLI), installed and signed in to your game namespace. The AGS CLI includes the AMS commands that upload server images with debug symbols. For more information, see Install and sign in. If you still use the standalone AMS CLI, use
ams uploadwith the--symbolFilesflag instead, or see Migrate from AMS CLI. - The following permissions in your game namespace:
| Task | Permission | Action |
|---|---|---|
| View Server Crashes and download files | ADMIN:NAMESPACE:{namespace}:AMS:ARTIFACT | Read |
| Change the core dump collection rate of a fleet | ADMIN:NAMESPACE:{namespace}:AMS:ARTIFACT | Update |
| Open fleet and server details from a crash | ADMIN:NAMESPACE:{namespace}:ARMADA:FLEET | Read |
| Upload server images | AMS:UPLOAD | Create, Update |
The Server Crashes menu is hidden from users who do not have the Read action on AMS:ARTIFACT. For more information, see Required Permissions for Admin Portal.
Enter AMS:UPLOAD without the ADMIN:NAMESPACE:{namespace}: prefix. If you sign in to the AGS CLI with an Identity and Access Management (IAM) client, the client needs this permission. If you sign in with your user account, your user role needs it. The default AMS Access role lets you manage server images but does not include AMS:UPLOAD.
Key terms
| Term | Definition |
|---|---|
| Crash event | A record of one dedicated server that exited with the status Crashed (a non-zero exit code or a terminating signal) or Start error (the server process failed to start). |
| Crash | A group of crash events that share the same call stack. Each crash is listed on the Crashes tab with an ID, such as SRV-12. |
| Core dump | A snapshot of the memory of the server process at the time of the crash. AMS requires a core dump to generate a call stack. |
| Debug symbols | Files generated by your build that map memory addresses to function names, source files, and line numbers. |
| Call stack | The sequence of function calls that led to the crash, for each thread of the server process. |
| Crash-free servers | The percentage of servers that ran during the selected period without crashing. |
Set up crash reporting
Crash events are recorded for all fleets by default. To generate call stacks and group crashes, complete the following steps. Until the setup is complete, the Server Crashes page displays a Set up crash reporting checklist.
Step 1: Allow your dedicated server to write core dumps
On Linux, a core dump is written when a process is terminated by a signal such as SIGSEGV or SIGABRT. Ensure that your dedicated server is configured to allow this:
- Do not set the core file size limit to
0(for example,ulimit -c 0) in your server image or launch script. - If your server handles fatal errors internally, ensure that it exits with a non-zero exit code. An exit code of
0is treated as a normal shutdown and is not recorded as a crash.
Servers terminated with SIGKILL, for example due to insufficient memory, do not produce a core dump. These crash events are still recorded, but without a call stack.
Step 2: Upload your server image with debug symbols
By default, ags ams upload excludes symbol files with the .debug, .sym, and .pdb extensions from the image. To include them, add the --symbol-files flag. Ensure that the debug files from your engine's Linux build are located in the upload directory:
- Separate debug files must end in
.debug, or be named in the.gnu_debuglinksection of the executable, so that Server Crashes can match them to the binary. - Unity: the
--symbol-filesflag uploadsUnityPlayer_s.debugandasu_s.debug. For IL2CPP builds, the line number fileLineNumberMappings.jsonis always uploaded. - Unreal Engine: a packaged Linux server build writes
<Project>Server.debugand<Project>Server.symnext to the server binary in<Project>/Binaries/Linux/. The--symbol-filesflag uploads both. Server Crashes uses the.debugfile and ignores the.symfile. Keep the.debugfile next to the binary. Do not setbPreservePSYM=TrueinDefaultEngine.ini: it replaces the.debugfile with a.psymfile, which is not uploaded or used.
Include the debug symbol files every time you upload an image. Symbols are matched to crashes by image and build ID, and cannot be added to an image after it is uploaded. Without them, call stacks display memory offsets instead of function names, and the crash is labeled Missing symbols.
ags ams upload --path <path_to_server_folder> --executable <exec_command> \
  --image-name <image_name> --symbol-files
The AGS CLI detects the CPU architecture from the executable. If the entrypoint is a shell script (.sh), also add --target-arch linux-x86_64. To check which files will be uploaded, including symbol files, add --dry-run. The dry run runs locally and does not require you to sign in. To view all upload options, run ags ams upload --help.
Debug files can be several times larger than the server binary, so uploads with --symbol-files take longer.
Step 3: Enable core dump collection for your fleets
A fleet collects core dumps only when its Core dumps on crash sampling rule is enabled.
- Fleets created in the Admin Portal collect core dumps from crashed servers by default. In the Logs & Artifacts Sampling section of the fleet form, the core dump option is labeled On by default.
- For fleets created through the API or the CLI, and for existing fleets, you must enable core dump collection. To enable it through the API, set
samplingRules.coredumps.crashedto{ "collect": true, "percentage": 100 }. For more information, see Sampling rules.
To change the core dump collection rate of existing fleets in the Admin Portal, follow these steps:
- In the Admin Portal sidebar, go to Multiplayer Servers > Server Crashes.
- Click Crash reporting settings.
- In the Core dump collection section, set Core dumps from crashed servers for each fleet. To apply the same rate to all fleets, select a rate in Set all fleets to, then click Set for all fleets.
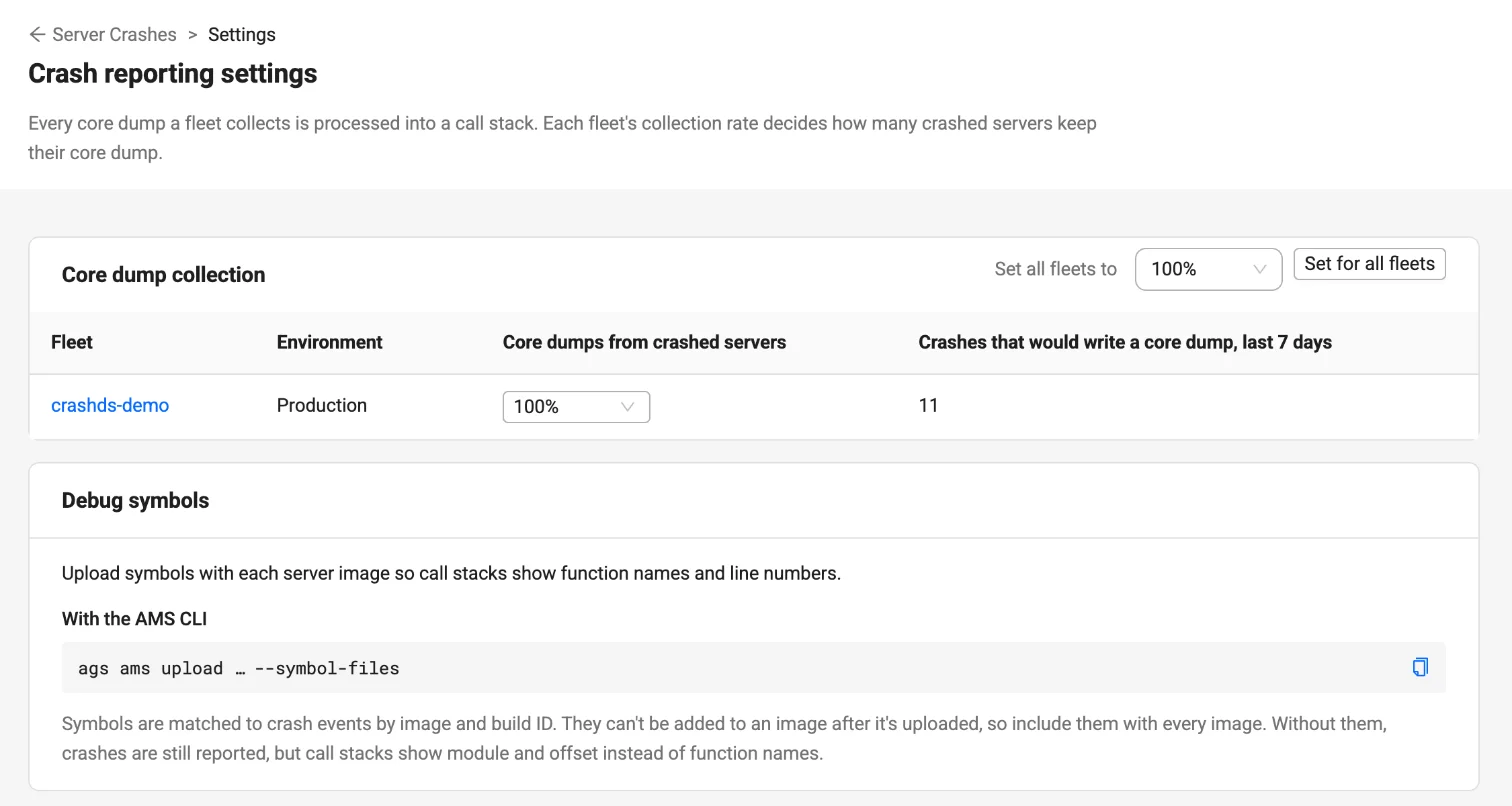
Changing the collection rate does not require the fleet to be deactivated. The new rate applies from the next crash. You can also change the rate from the fleet details page by clicking Change in the Core dump collection section.
Set the collection rate to 100% so that every crash event has a call stack. At a lower rate, only that percentage of crashed servers retain their core dump, and the remaining crash events are labeled Skipped by sampling. To estimate the core dump volume of a fleet, refer to the Crashes that would write a core dump, last 7 days column.
Also keep Logs on crash collection enabled, so that each crash event includes the final lines of the server log.
Verify the setup
After the next crash occurs, open the Server Crashes page. The crash event is displayed on the Crash events tab immediately. The core dump and log are typically available within a few minutes, followed by the call stack. Processing time increases with the size of the core dump.
View and investigate crashes
Open the Server Crashes page
In the Admin Portal sidebar, go to Multiplayer Servers > Server Crashes.
The summary tiles at the top of the page cover the last 7 days. To change core dump collection and view the debug symbol upload instructions, click Crash reporting settings.
If any fleet recorded crashes during this period without collecting core dumps, a warning lists the affected fleets with a Review fleets link.
Summary tiles
| Tile | Description |
|---|---|
| Crash events, last 7 days | The number of crash events, and the change compared with the previous period of the same length. |
| Crash-free servers | The percentage of servers that ran during the period without crashing. |
| Killed (SIGKILL) | The number of servers that were terminated due to insufficient memory or stopped by AMS. These servers do not produce a core dump. |
| Top exit code | The most frequent exit code, and the number of crash events with that exit code. |
Summary tile data may be delayed by a few minutes relative to the crash lists.
Crashes tab
The Crashes tab lists crashes, where each crash is a group of crash events with the same call stack. Use this tab to identify the issues that occur most frequently.
- The tab displays the Crash (title and top function), Events, First seen, and Last seen columns.
- To filter the list, use Search by title or function, or select Missing symbols only.
- Crash events without a call stack, such as
SIGKILLexits, error exits, and crashes without a core dump, are not assigned to a crash. These events are listed on the Crash events tab only.
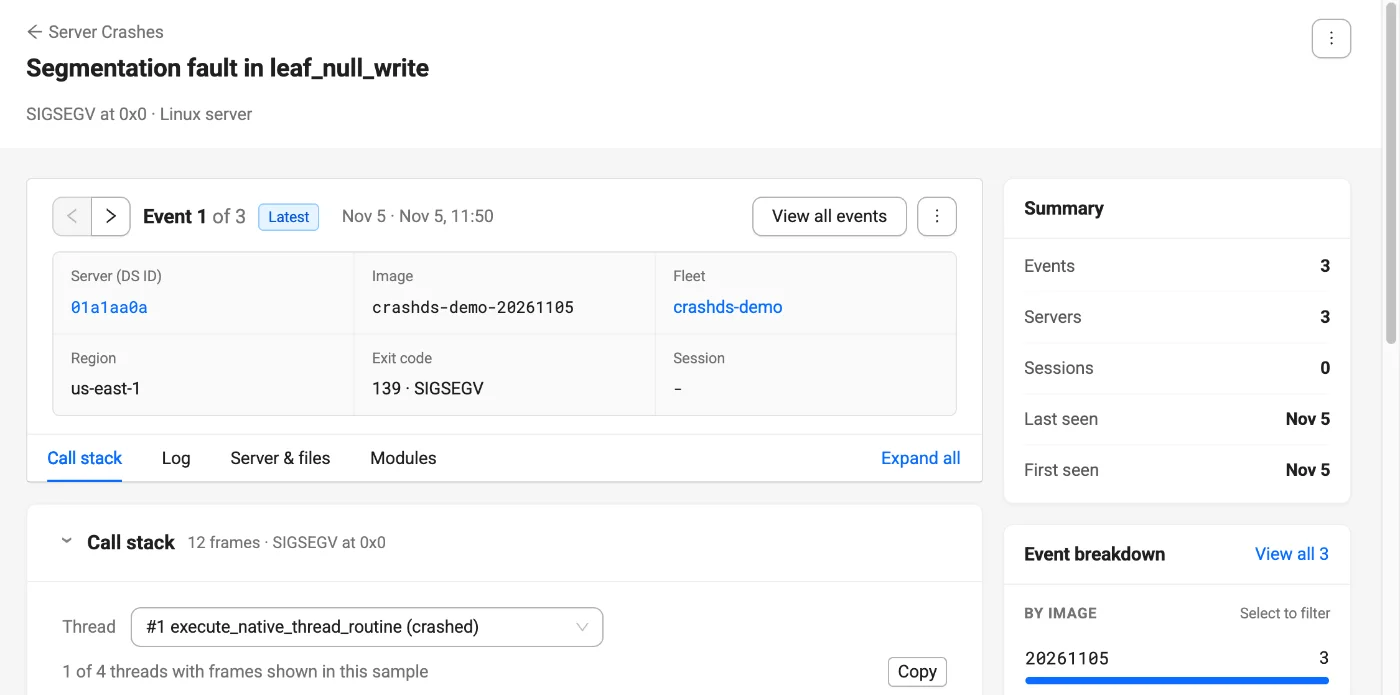
To view the details of a crash, click it. The crash details page contains the following information:
- Summary: the number of events, servers, and sessions, and the times the crash was first and last seen.
- Event breakdown: the distribution of events By fleet and By image. Select a row to filter the event list.
- The details of the selected event, including its call stack and log. Use the arrow buttons to move between events, or click View all events to list every event in the crash.
- All events: the complete list of crash events in the crash.
Crash events tab
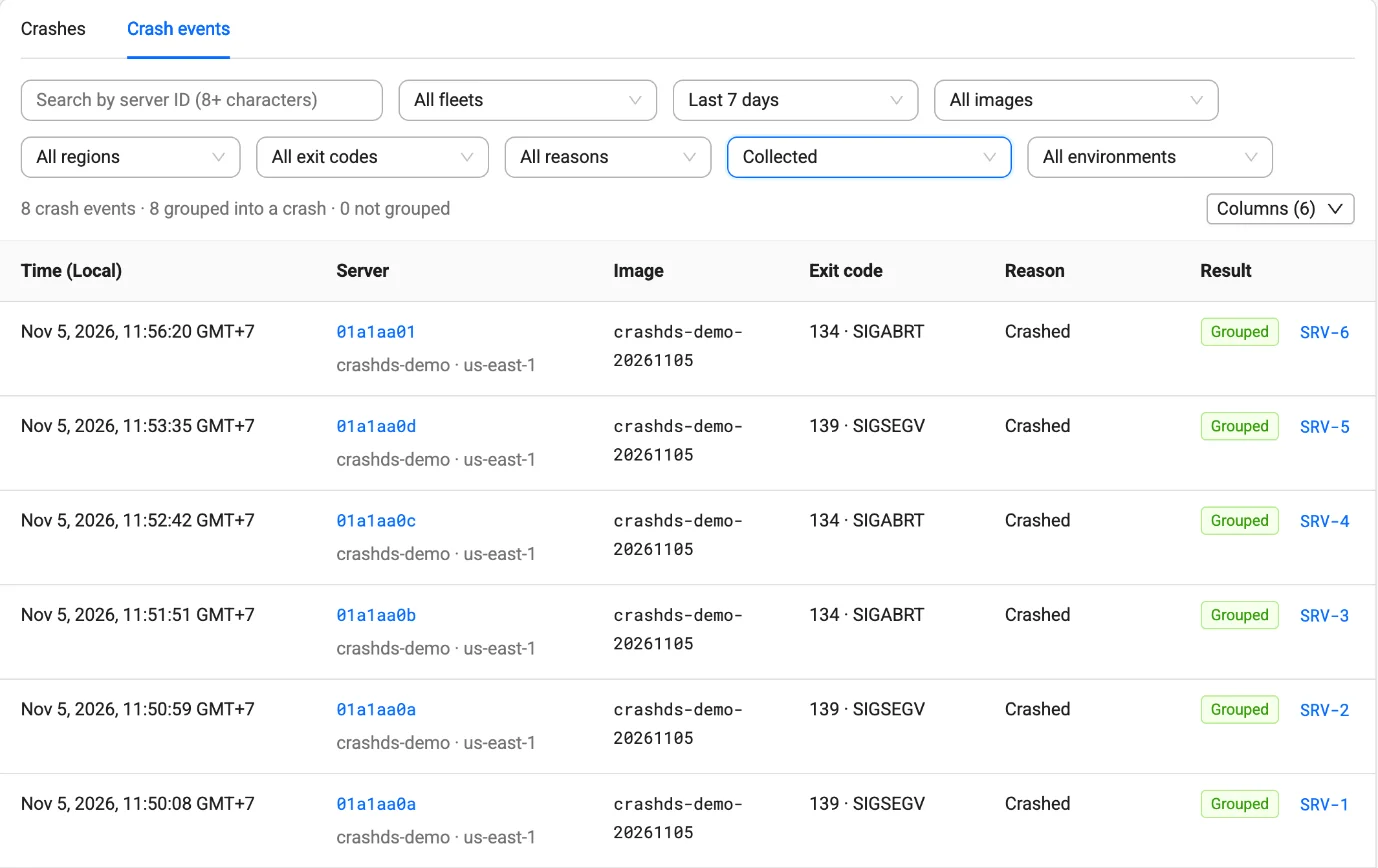
The Crash events tab lists each crashed server, sorted from newest to oldest.
- By default, the tab displays the Time, Server, Image, Exit code, Reason, and Result columns. To display the Fleet, Region, Session ID, Core dump, Log, and Call stack columns, click Columns.
- You can filter the list by time range, fleet, environment (Fleets only or Development servers), image, region, exit code, reason (Crashed or Start error), and core dump status (Collected, Skipped by sampling, Failed, Expired, or Not collected).
- To search by server ID, enter at least eight characters.
The selected filters are stored in the page URL, so you can share a filtered view by copying the link.
Crash event details
To view the details of a crash event, click its server ID. The event view displays the server, image, fleet, region, exit code, and session of the event, and contains the following tabs:
- Call stack: the frames of the crashed thread, starting from the First frame with source. Runtime frames above it are hidden by default. To display them, click Show runtime frames above it. To view another thread, use the Thread selector.
- Modules: the binaries loaded in the process, their build IDs, and whether their symbols were found.
- Log: the final lines written by the server before the crash, and the crash message from the engine's crash report, if available. To download the full log, click Download logs (.zip).
- Server & files: the DS ID, fleet, image, region, IP address, session ID, and exit code, and the Core dump and Logs files with their sizes and expiration dates.
- Server history: the state transitions of the server from start to crash (Creating, Ready, Claimed, and Removed).
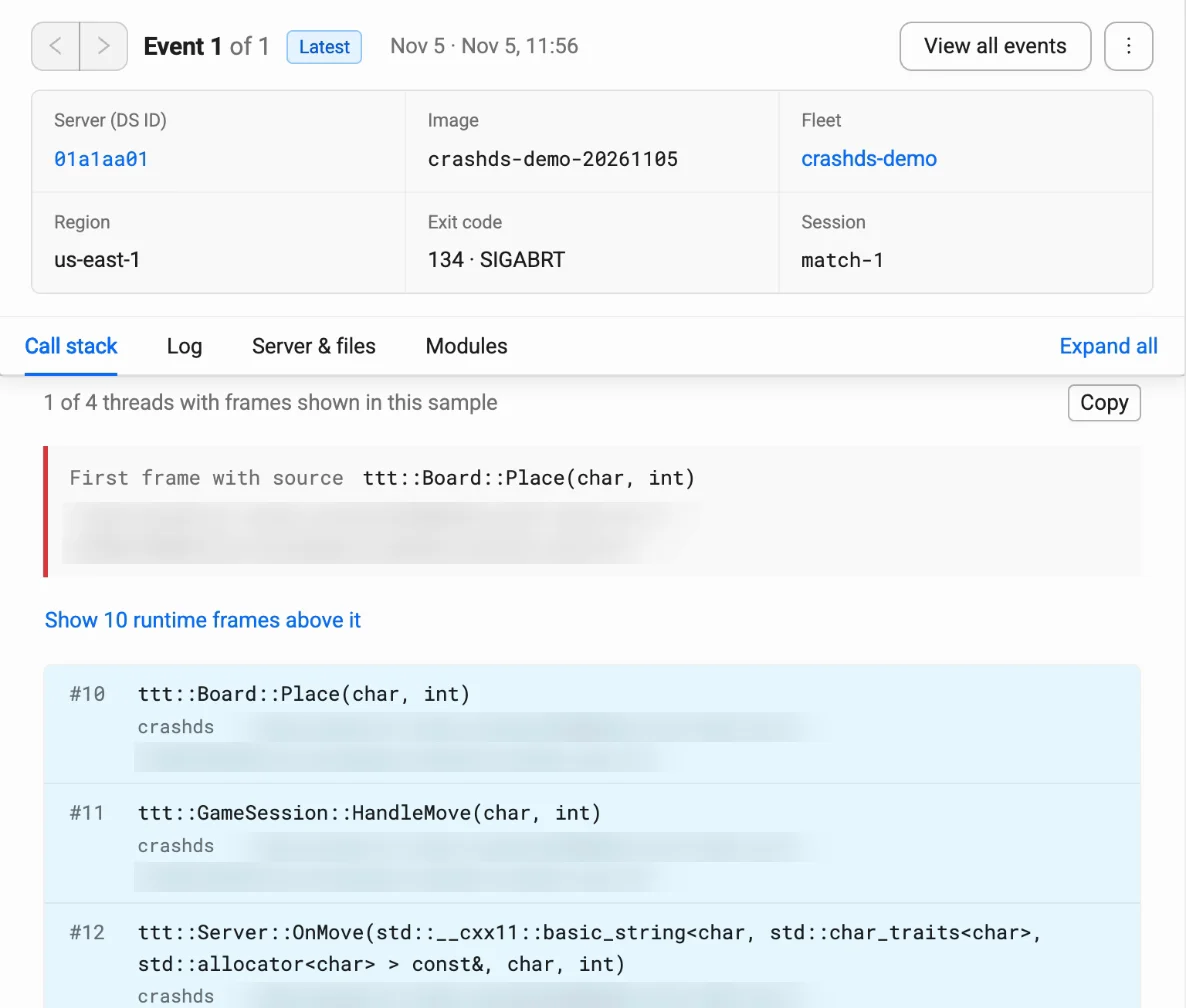
The page also provides the following actions:
- Download core dump: downloads the core dump for local analysis with a debugger, such as
gdb. - Reprocess: regenerates the call stack, for example after a processing failure.
- Open fleet, View server details, and Copy server ID: open the related fleet or server, or copy the server ID.
- Turn on collection or Change sampling rate: displayed when the fleet did not retain the core dump.
Crash information is also available from fleet pages. The fleet list displays the Crash events, 24 h column and the core dump collection rate of each fleet. The fleet details page includes a View crashes link, and the details page of a crashed server includes a View crash event link.
Crash event results
The Result column and the header of the crash event details page indicate how AMS processed each crash event.
| Result | Description | Recommended action |
|---|---|---|
| Grouped | The call stack is available and the event is assigned to a crash. | Open the crash to view all of its events. |
| Processing | The core dump is being processed into a call stack. | Wait a few minutes, then refresh the page. |
| Waiting for core dump upload | The server crashed and its core dump is being uploaded. | Wait for the upload to complete. If the core dump is not received within two hours, the event is marked as having no core dump. |
| Missing symbols | The image was uploaded without debug symbols. The call stack displays module names and offsets only. | Include debug symbols when you upload the next image. See Step 2: Upload your server image with debug symbols. |
| No core dump · error exit | The server exited with an error exit code, so no core dump was written. | Review the server log to determine the cause of the exit. |
| No core dump · killed | The server was terminated with SIGKILL due to insufficient memory, or was stopped by AMS. | Review the memory usage of your server and the instance type of the fleet. |
| No core dump · collection off | Core dump collection is disabled for the fleet. | Enable core dump collection. See Step 3: Enable core dump collection for your fleets. |
| Skipped by sampling | The fleet collects core dumps from a percentage of crashed servers, and this server was not selected. | Set the collection rate to 100%. |
| No core dump found | The server was terminated by a signal that normally produces a core dump, but no core dump was found on the VM. | Ensure that the core file size limit is not set to 0. See Step 1: Allow your dedicated server to write core dumps. |
| No call stack · core dump failed | AMS was unable to collect the core dump. The reason is displayed on the page when available. | Review the reason. If the issue persists, contact AccelByte support and provide the server ID. |
| Not processed · limit reached | The fleet exceeded 50 crashes of the same image within one hour. Additional core dumps are not processed, to protect the processing queue. | Download the core dump for local analysis, or click Reprocess. |
| Processing failed | The core dump could not be processed into a call stack. The reason is displayed on the page. | Resolve the displayed reason, then click Reprocess. |
| Not processed · crashed before launch | The crash occurred before crash reporting was enabled for your namespace. | Click Reprocess to generate a call stack. |
| Status unavailable | The call stack status cannot be retrieved at this time. Crash details from AMS are still displayed. | Try again later. |
Data retention and limits
- Core dumps and logs are retained for 30 days after the crash, after which they are deleted. Call stacks and the log excerpt remain available on the crash event details page after the files are deleted.
- The Server Crashes page displays data for up to the last 30 days.
- Call stacks are generated for x86-64 Linux servers (
linux-x86_64) only. Fleets that run ARM64 images (linux-arm_64) record crash events, core dumps, and logs, but no call stacks. - Core dumps larger than 16 GiB when uncompressed are not processed into a call stack. These core dumps remain available for download and local analysis.
- Crash events may not be recorded for servers that were lost due to a VM failure.
Troubleshooting
A crash event has no call stack
Check the Result of the crash event and follow the recommended action in Crash event results. The most common causes are disabled core dump collection, a collection rate below 100%, and SIGKILL exits.
Local dedicated servers registered with AMS for development cannot collect core dumps or logs, so their crash events never have a call stack. To obtain a call stack, reproduce the crash on a fleet.
Call stacks display memory addresses instead of function names
The server image was uploaded without debug symbols, or with symbol files from a different build. Upload a new image with the symbol files from the same build, then update your fleet to use the new image. For more information, see Update to a new DS Version.
Before you upload, run ags ams upload with --dry-run to check that the symbol files are included.
If you use Unreal Engine, check that the build contains a .debug file next to the server binary. Shipping builds may not include debug files by default. If call stacks still display memory addresses, contact us.
Crashes caused by the same issue are in different groups
Crashes from images without debug symbols are grouped per image, because their call stacks contain memory offsets only. Upload your images with debug symbols so that crashes caused by the same issue are grouped together across images.
A stopped server is not listed
Server Crashes lists only servers that exited with the status Crashed or Start error. Normal exits (exit code 0), session timeouts, and unresponsive servers stopped by AMS are not recorded as crash events. To review these exits, go to Multiplayer Servers > Fleet Manager, open the fleet, and click the History tab in the Dedicated Server List section. The tab lists the servers of the fleet from the past 30 days with their final status.
New servers in a fleet start slowly after repeated crashes
When servers in a fleet crash repeatedly, AMS increases the delay before it starts new servers (crash backoff). The fleet details page displays the number of servers in crash backoff. Resolve the cause of the crash, then upload a new image.