View observability dashboards
The AccelByte Gaming Services (AGS) Observability platform is available to:
- Private Cloud customers: AGS Observability is in open beta for AGS Private Cloud customers, providing unrestricted access to the Grafana menu in the Admin Portal. This may change in the future, and access restrictions could be applied based on subscription plans and other criteria.
- Public Cloud customers: AGS Observability is available as part of the full Extend add-on package. This means that Public Cloud customers can only access observability dashboards for their Extend apps. For more information, refer to the Extend Observability page.
Overview
This page walks you through how to find and view Game Health and Extend Observability dashboards in Grafana.
Find and view dashboards
-
On the Grafana home page, click Dashboards on the sidebar.
-
From the list, find and open the folder for the dashboard group you want to view, for example, Game Health Dashboard or Extend Dashboards. You can also type in the dashboard name in the search box and open from the results.
-
From the list of dashboards, click on the name of the dashboard you want to view. That dashboard's page appears, showing all its metrics.
Modify the displayed dashboard data
You can adjust the data displayed on any observability dashboard by changing the namespace and time period.
Change namespace
AGS Observability dashboards show data per game namespace. Use the Game Namespace filter to show the data of a specific game namespace.

Change time period
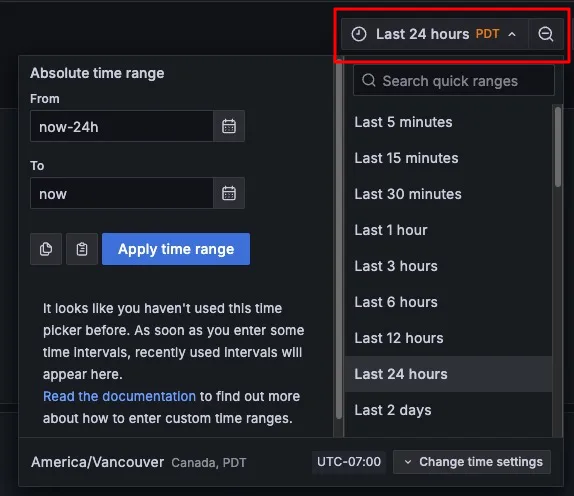
Specify the time period of the data you want to generate. The time period setting is at the top-right side of the dashboard.
Check dashboard panel descriptions
To check the description of a panel in a dashboard, hover to the info (i) icon.

Refer also to the Game Health dashboards and Extend Observability pages for more information about these dashboards.
Next step
Check out the full list of Game Health dashboards and Extend Observability dashboards and understand the metrics they each provide.