Introduction to Extend Observability
AGS Observability is part of the full Extend package, available in both AGS tiers: Private Cloud and Public Cloud. For Public Cloud users on a free trial, you can access observability dashboards and all other Extend features once you unlock the tier.
Overview
AGS Extend includes built-in observability dashboards for your Extend apps. These dashboards cover infrastructure health, service metrics, and logs so you can monitor and troubleshoot your apps.
Extend offers observability dashboards for each type of Extend apps, refer to the guide for each app type:
Apart from the Extend dashboards, AGS Observability also offers other dashboards such as Game Health dashboards, AMS Dashboard, and custom dashboards (or dashboards created based on customer request and requirements). For more information, refer to the AGS Observability page.
Access observability dashboards
You can get the access link for your observability dashboards from the details page of your Extend apps. Follow these steps:
-
Go to the details page of the Extend app with the observability dashboard you want to view.
-
At the bottom of the App Detail table, click Open Grafana. The Grafana sign-in page opens in a new browser tab.
-
On the sign-in page, click the Sign in with Admin Portal button and use your Admin Portal credentials to log in.
To learn how to navigate observability dashboards, refer to the guide for each app type:
Infrastructure health metrics
The following infrastructure metrics are available in Grafana:
- App instances count & status
- CPU Utilization
- Limit
- Request
- Memory consumption
- Limit
- Request
- Storage
- Disk Space
- IOPS
- Network
- Bandwidth
- Network usage
Service health metrics
The following service metrics can be accessed in Grafana:
- Request count
- gRPC
- Total request
- Total request per gRPC status code
- Request latency
- Error rates
- HTTP
- Total request
- Total 2xx request
- Total 4xx request
- Total 5xx request
- Request latency
- gRPC
- Incoming kafka events (if applicable)
- Application creation duration
- Deployment creation duration
Metrics and logs query capabilities
You can view your application logs and metrics directly in Grafana. AGS configures your tenant datasources to query from the central metrics and log stores, so your app data is automatically available. To query metrics and logs, follow these steps:
-
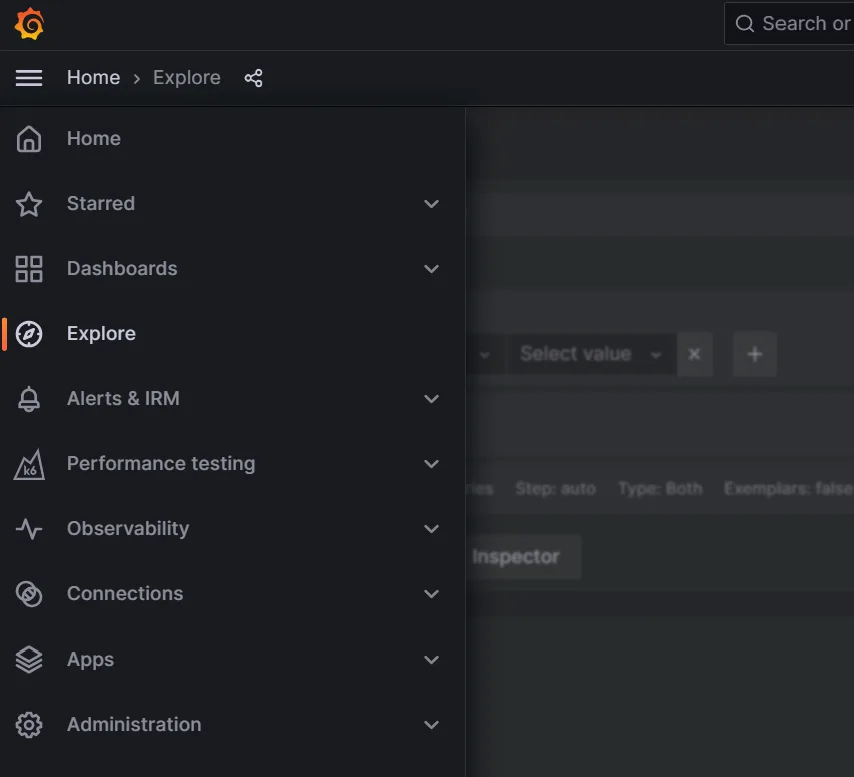
On the sidebar, go to the Explore section.
-
Grafana provides a query editor that allows you to specify the exact metrics or log data you want to retrieve. Data sources for your application usually follow the pattern
log-<your studio name>ormetrics-<your studio name>. You can pick the data source for logs/metrics by accessing the dropdown on the top.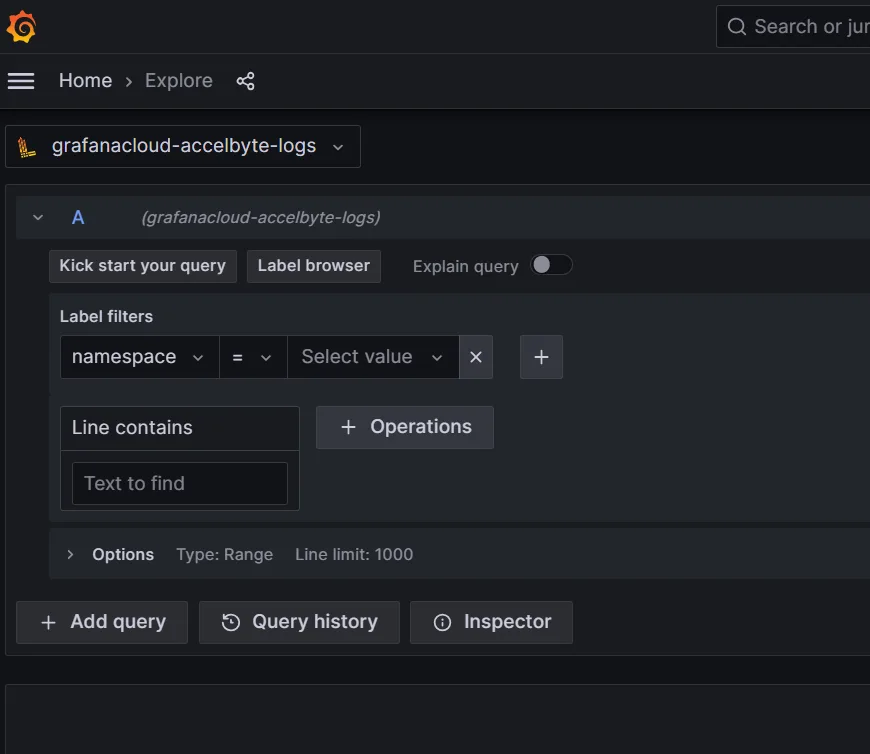
-
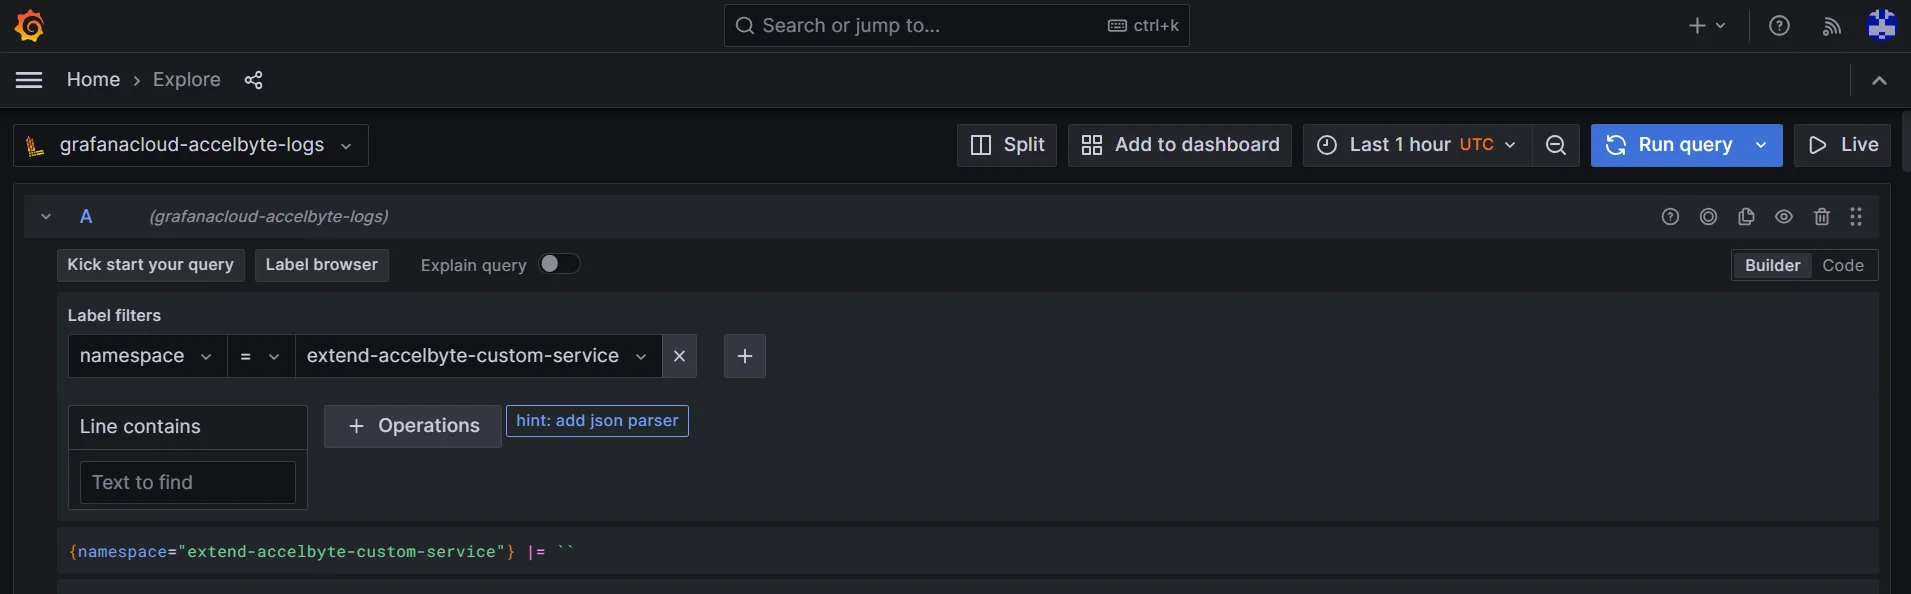
To get your application data, apply the label filters. Choose the namespace label and select
extend-accelbyte-custom-serviceas the value. You can also narrow down the result by utilizing the time filters. -
Once your queries are defined, you can execute the query using the run query button in the top-right.
-
Grafana returns logs and metrics based on the defined queries in JSON format.
Send logs for collection
You can send logs from your Extend app to the observability platform by writing the logs to standard output.
- C#
- Go
- Java
- Python
Use ILogger<YourClassName> object in your gRPC service implementation class to write logs.
// Import namespace
using Microsoft.Extensions.Logging;

// Declare private logger object
private readonly ILogger<YourClassName> _Logger;

// Get logger object in constructor
public YourClassName(
  ...
  ILogger<YourClassName> logger,
  ...
)
{
  ...
  _Logger = logger;
  ...
}

// Use it within the method
_Logger.LogInformation("your log message");
// Import required package
import (
  "github.com/sirupsen/logrus"
)

// Write log
logrus.Infof("your log message")
// Import Slf4j package
import lombok.extern.slf4j.Slf4j;

// Add Slf4J annotation to your service class
@Slf4j

// Use it within the method
log.info("your log message");
For more information about Slf4j annotation, refer to the Project Lombok documentation.
# Import logger
from logging import Logger

# init logger in service class
def __init__(
  ..., logger: Optional[Logger], ...
) -> None:
  ...
  self.logger = logger
  ...

# Use it within the function
self.logger.info("your log message")
Visualization
You can monitor the health of your Extend service using the available dashboards. After your Extend app is provisioned, the following dashboards are created automatically:
Dashboards
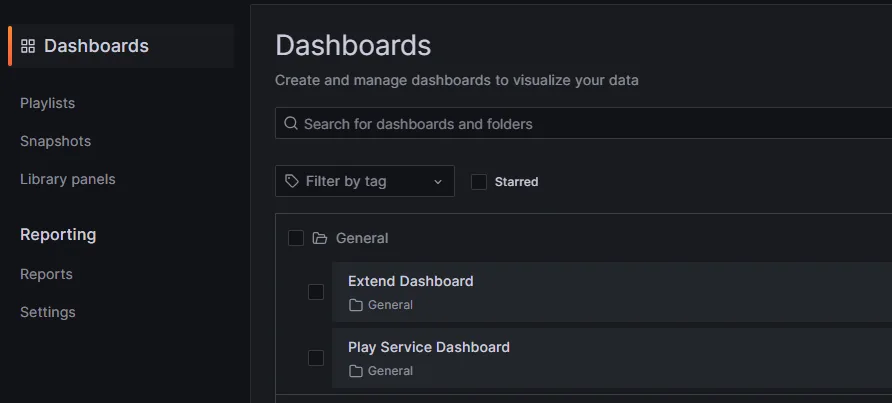
Dashboards are available in Grafana after you sign in through the Admin Portal. From the Grafana sidebar, go to Dashboards to browse your Extend dashboards.
Custom metrics
You can annotate and publish service-specific metrics to gain further insight into your app's performance. Support and documentation for these metrics will be added soon.