Extend Task Scheduler
The Extend Task Scheduler is currently an experimental feature and part of the Extend Event Handler family.
Overview
The Extend Task Scheduler enables you to manage background tasks such as log rotations, batch processing, security scans, health checks, and backups in the following ways:
- Schedule background tasks at a specific rate.
- Define and fine-tune the start and end times of background tasks to enable them to run during low-traffic or off-peak hours to optimize user's performance and experience.
The Extend Task Scheduler is based on the popular industry standard gRPC framework. You can download the app template here. If you can't access the app template, contact AccelByte Support.
Relevant files
-
task_scheduler.proto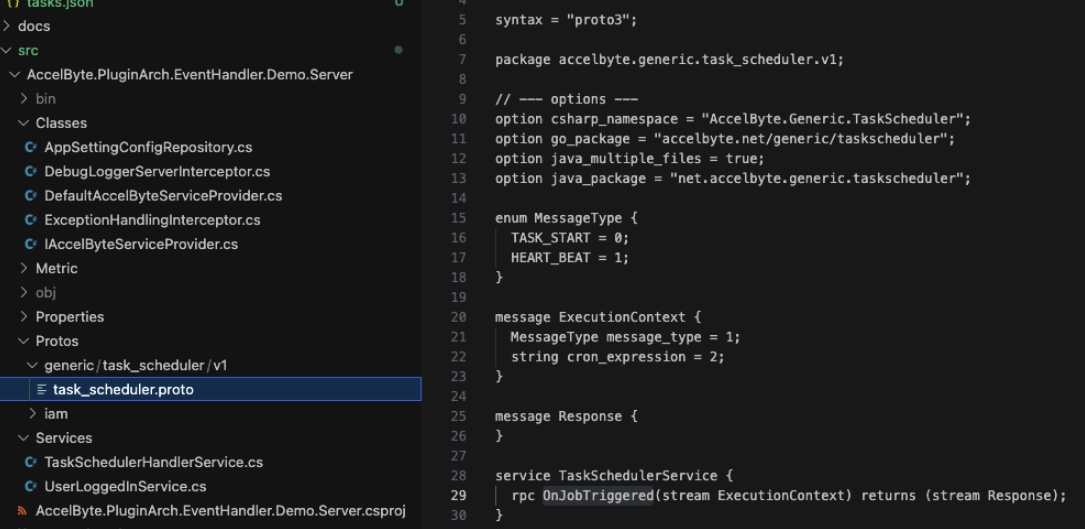
-
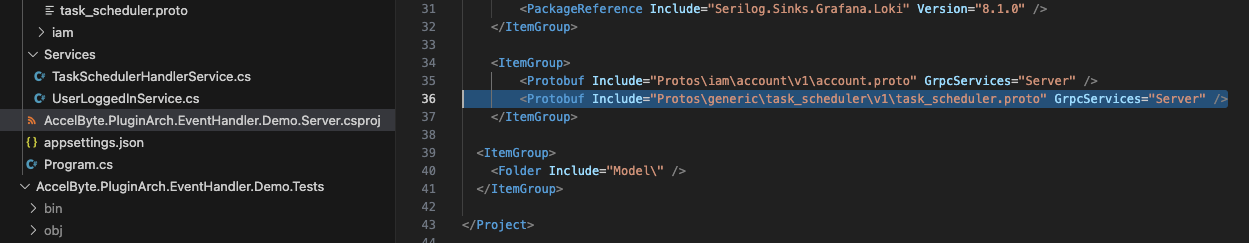
AccelByte.PluginArch.EventHandler.Demo.Server.csproj-
Add the new proto file reference. This is for the Proto code generation.
-
-
TaskSchedulerHandlerService.cs-
Implement your own gRPC service and onJobTriggered method.
-
Insert your code in the CustomScheduledTask() method.
-
-
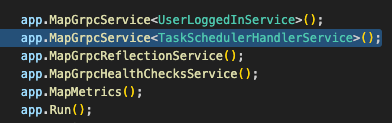
Program.cs:-
Add the new gRPC services under the service listing here for C#.
-
Configuration
To turn on the feature, register on the (AGS) Admin Portal, create the Event Handler app, then control it via these environment variables before the app deployment.
TASK_SCHEDULER_ENABLED
- The feature killswitch.
SCHEDULED_TASK
- The UNIX cron expression, enclosed in a pair of single quotes.
Cron expression
SCHEDULED_TASK is a string representation in the UNIX Cron format: [minute] [hour] [day of the month] [month] [day of the week].
Use single quotes to enclose the SCHEDULED_TASK Cron expression.
Examples
Fire every five mins everyday:
'*/5 * * * ?'
Fire at 10:15 A.M. everyday:
'15 10 * * ?'
Fire at 3:15 A.M. every Monday:
'15 3 ? * MON'
| Fields | Allowed Values | Allowed Special Characters |
|---|---|---|
| Minutes | 0-59 | , - * / |
| Hours | 0-23 | , - * / |
| Day of month | 1-31 | , - * ? / L W |
| Month | 1-12 or JAN-DEC | , - * / |
| Day of week | 1-7 or SUN-SAT | , - * ? / L # |
To enable the solid delivery of the app, we use the Quartz Job Scheduler common library, which is a robust and proven rich featured scheduler library. In order to maintain full compatibility and portability with the industry standard UNIX Cron format, we have implemented this common library specifically to eliminate the seconds and the optional year field behind the scenes.
For more detailed examples, refer to Quartz's tutorial about Cron Trigger.
There is a specific requirement (originated from Quartz): you cannot use asterisk (*) in both day of month and day of week. Only one of the two can use an asterisk; the other has to be use a question mark (?).
Observe Extend app logs and metrics
This section covers how to observe the logs and metrics of the Extend app.
Observe Extend app logs and metrics via Grafana Cloud
You can access the Extend Observability tool, Grafana Cloud, by going into your Extend app detail page and clicking Open Grafana Cloud. The Logging and Metrics sections use the Grafana Cloud to show you how to get your Extend app logs and metrics.
To observe the Extend app logs, you can use the Grafana Cloud tool. You can access it via the Extend app details page. For information on how to navigate within the Grafana Cloud, refer to Extend Event Handler Observability.
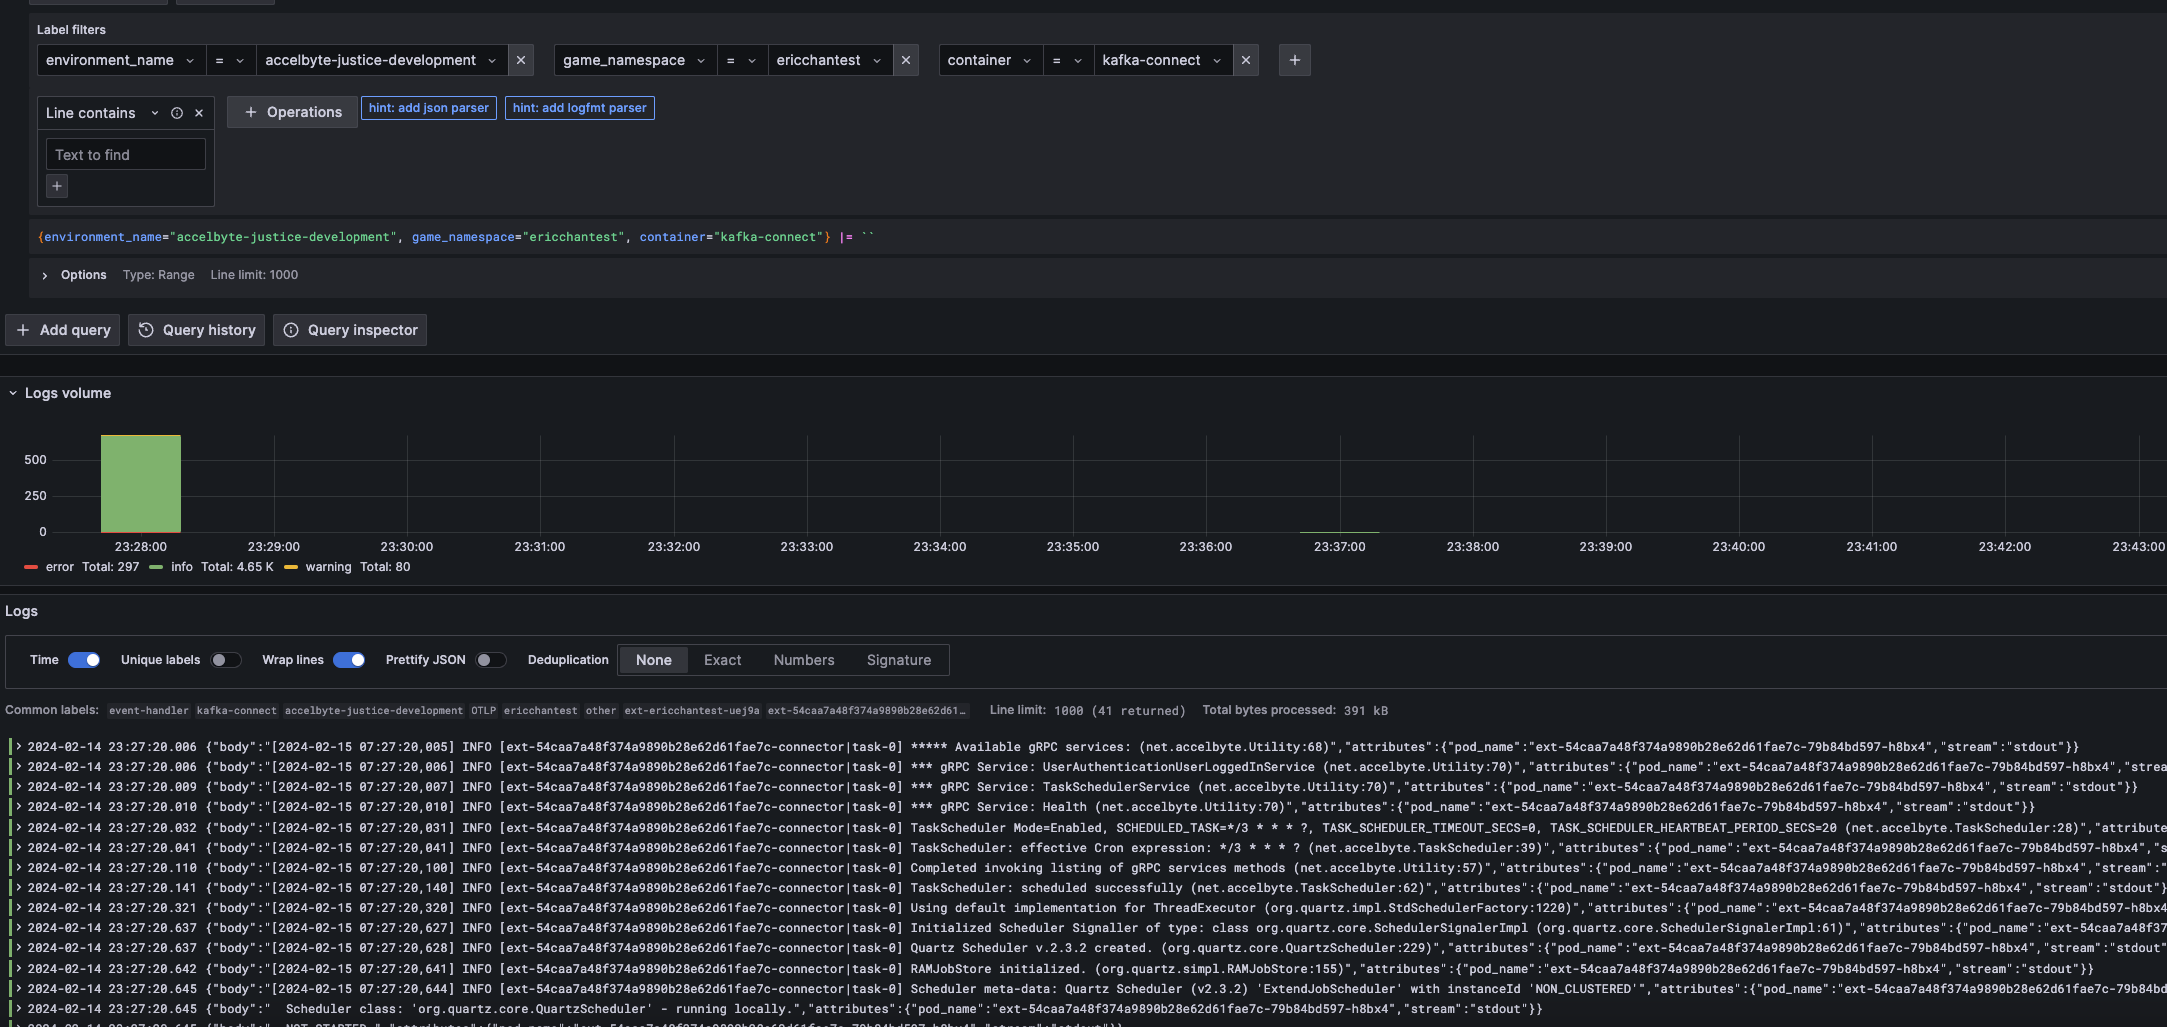
Kafka Connect logs
When all the above are satisfied, you will see in the Kafka Connect log and image similar to the following:
[extend-connector|task-0] ***** Available gRPC services: (net.accelbyte.Utility:68)
...
[extend-connector|task-0] *** gRPC Service: TaskSchedulerService (net.accelbyte.Utility:70)
...
[extend-connector|task-0] TaskScheduler Mode=Enabled, SCHEDULED_TASK=* * * * ?, TASK_SCHEDULER_HEARTBEAT_PERIOD_SECS=20 (net.accelbyte.TaskScheduler:28)
[extend-connector|task-0] TaskScheduler: effective Cron expression: 0 * * * * ? (net.accelbyte.TaskScheduler:39)
[extend-connector|task-0] Completed invoking listing of gRPC services methods (net.accelbyte.Utility:57)
[extend-connector|task-0] TaskScheduler: scheduled successfully (net.accelbyte.TaskScheduler:62)
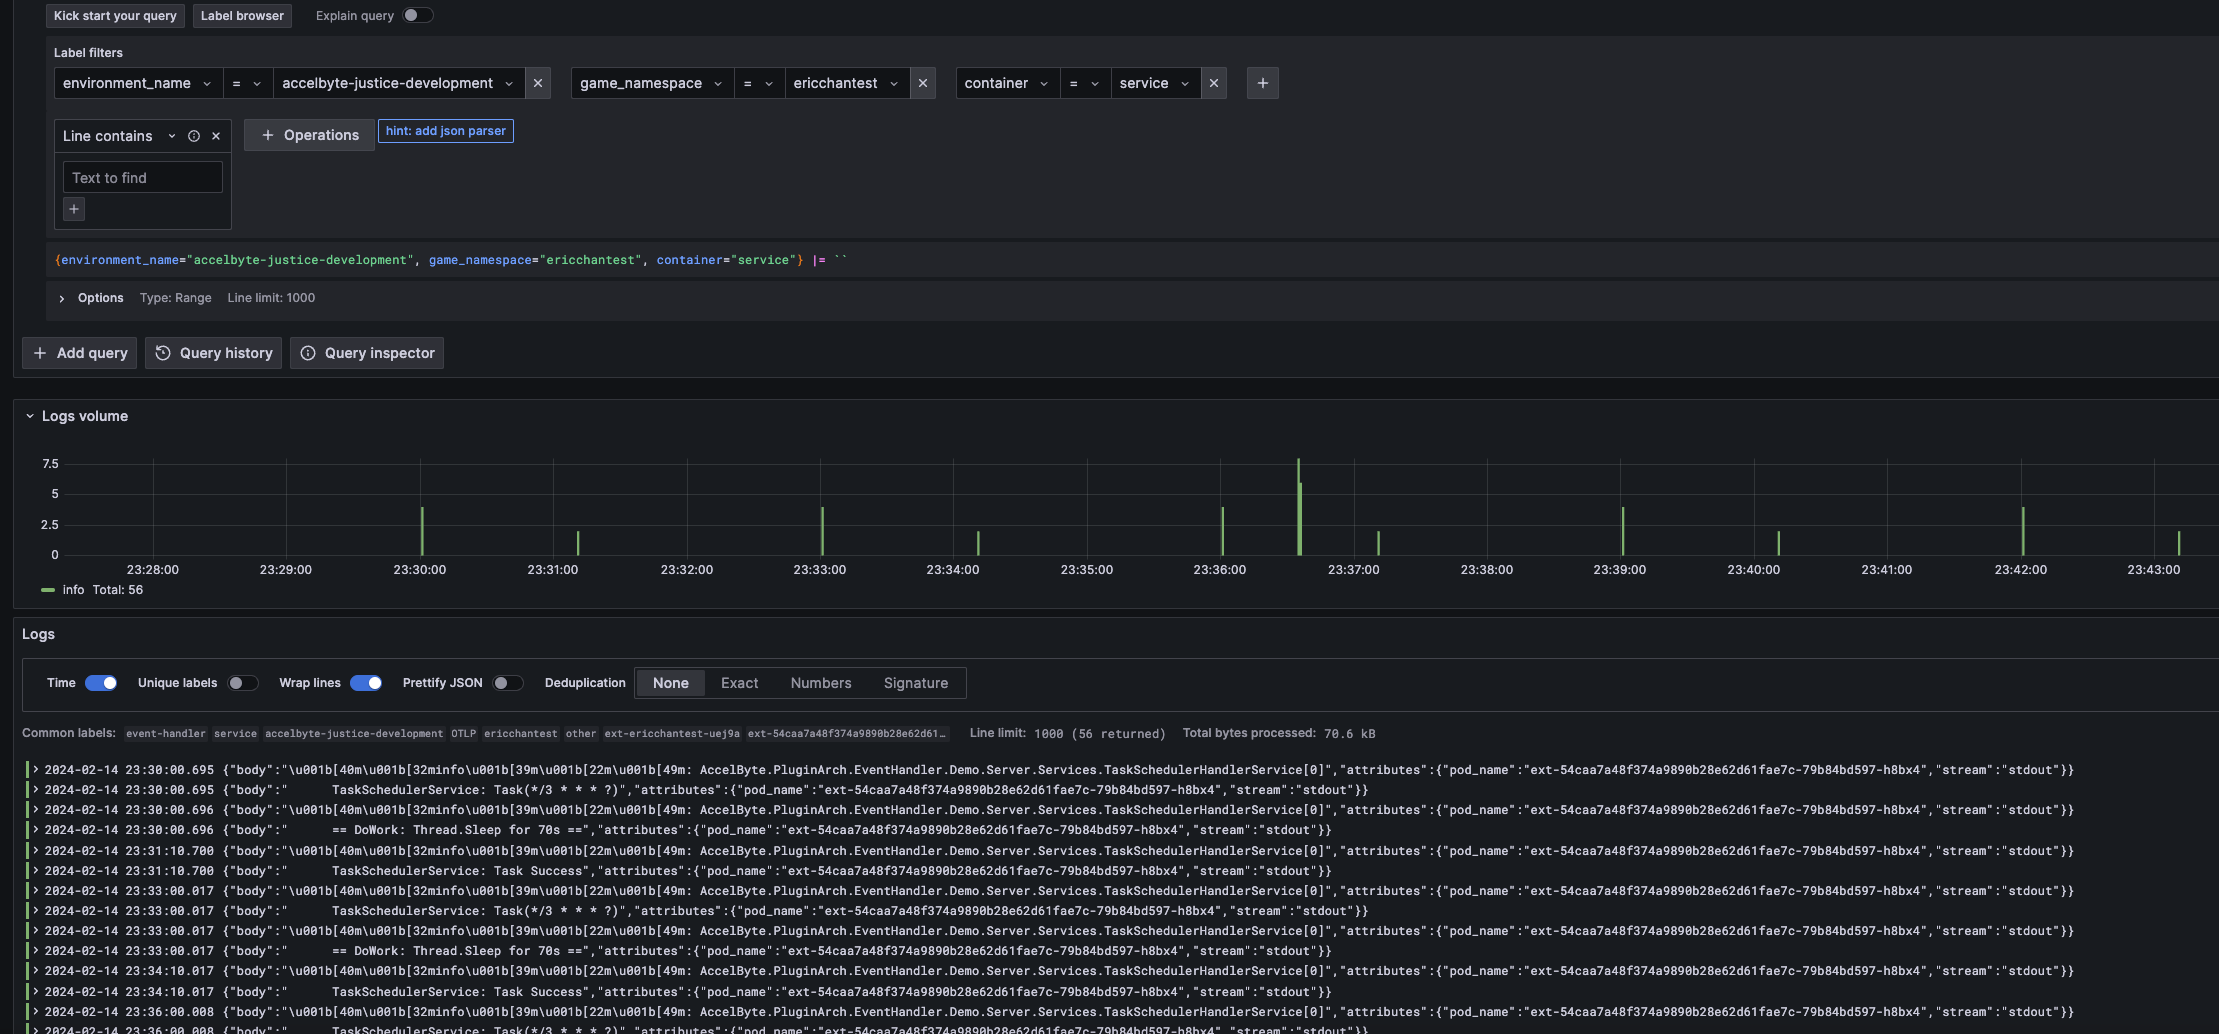
Event Handler Logs
Metrics
There are three metrics produced by the Task Scheduler:
-
kafka_bridge_scheduled_task_fired_total: total number of invocations fired to Event Handler as a result of the Cron trigger.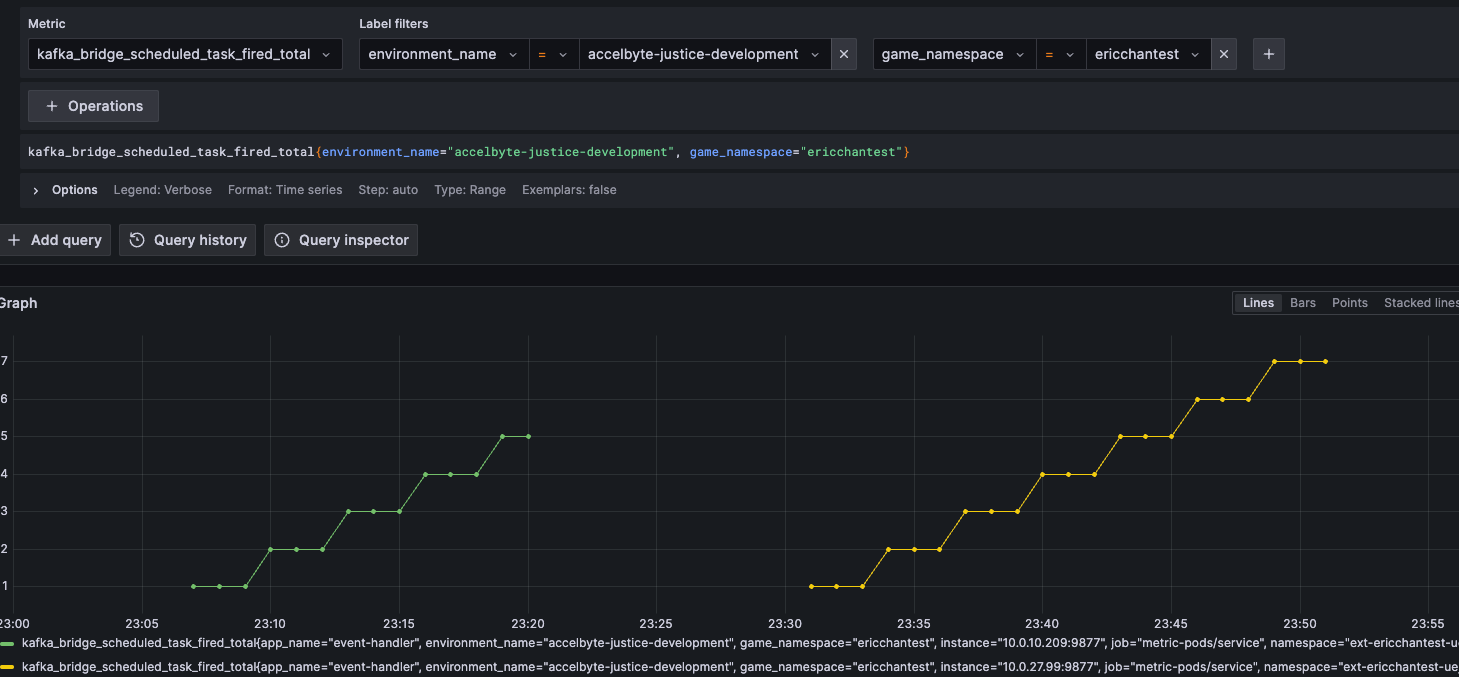
-
kafka_bridge_scheduled_task_completed_total: total number of invocations fired and successfully acknowledged for the task completion from the Event Handler.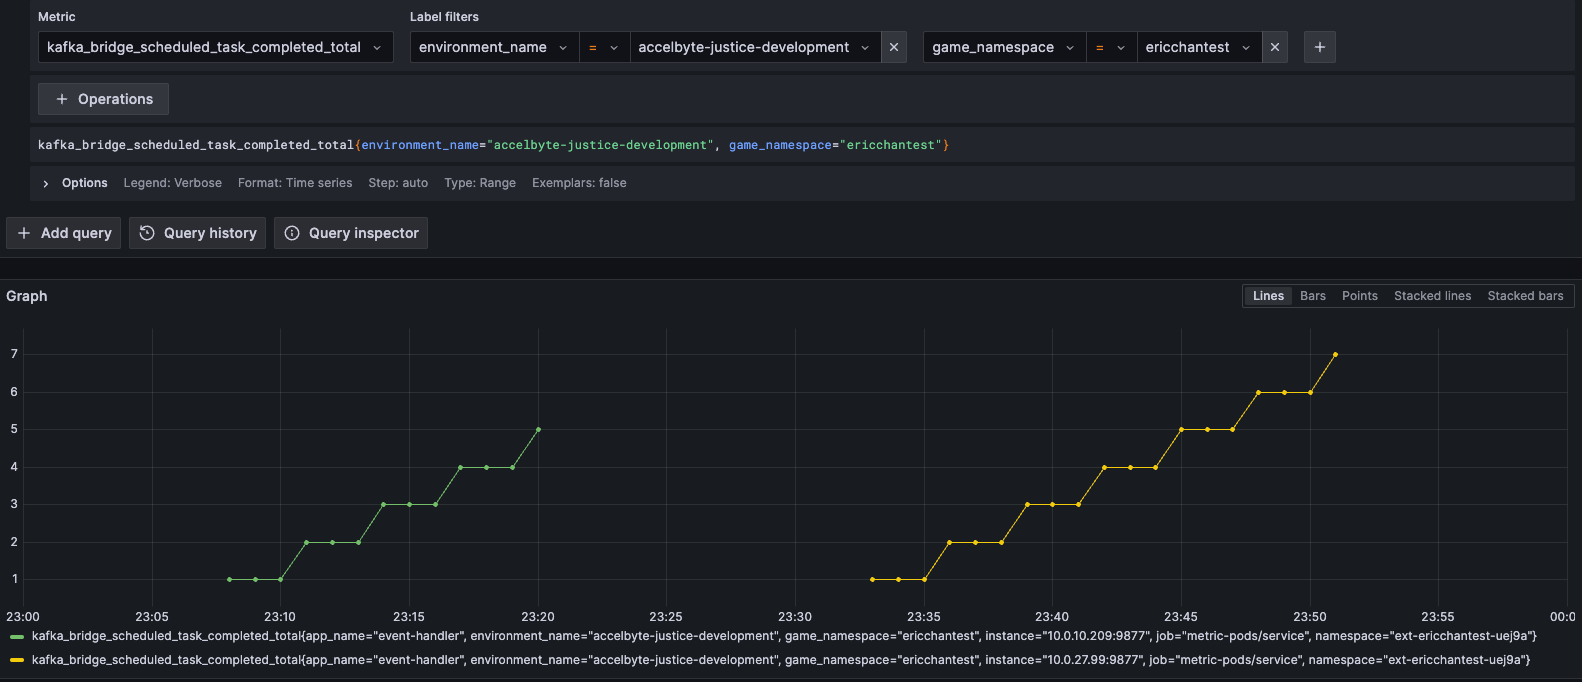
-
kafka_bridge_scheduled_task_failure_total: Total number of tasks that failed. For example, a failure can be a case when the Cron trigger is fired but the Event Handler while processing the scheduled job threw an Exception causing the stream to be closed.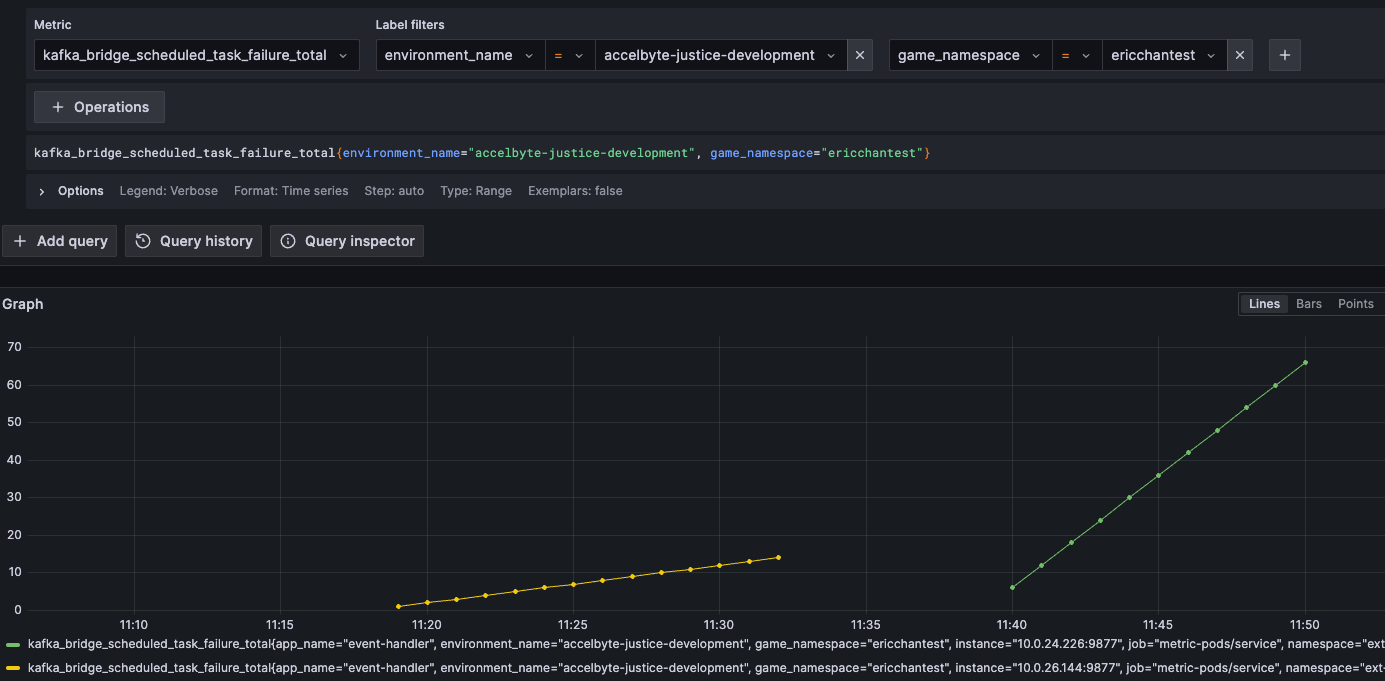
One pod restriction per app
The Task Scheduler is required to be running on a maximum of one instance per Extend app. As a result, you will need to make sure the Extend Event Handler only runs one pod. The pod count and limit is available from the Extend App Dashboard.
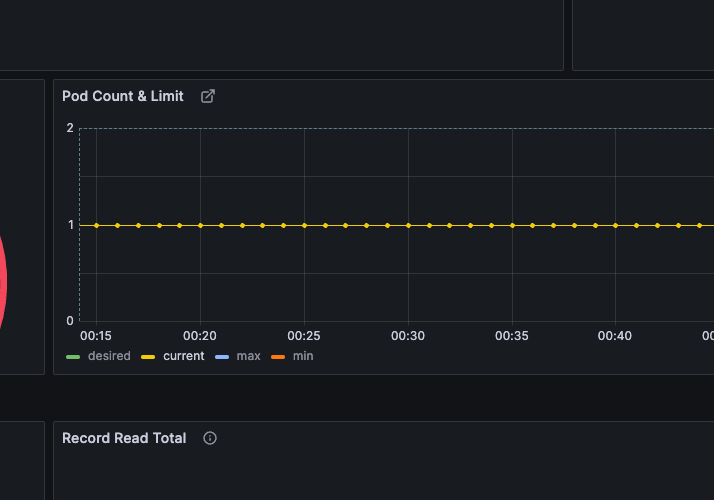
Click current to switch to the current pod view.
FAQs
Q: What are the steps in registering and creating my own Event Handler gRPC server?
A: For information, refer to Getting started with Event Handler. For the app template for this new feature, contact AccelByte support.
Q: The feature doesn't seem to be working. What should I do to enable it?
A: To enable the feature, follow these steps:
- Enable the killswitch:
TASK_SCHEDULER_ENABLED=true - Define the Cron expression with single quotes:
SCHEDULED_TASK: '*/5 * * * ?' - Define the gRPC service and method:
TaskSchedulerServicewith theOnJobTriggeredgRPC implemented- Registered under
Program.csin C# - gRPC reflection is turned on in
Programs.cs-app.MapGrpcReflectionServicemethod
Q: I've checked all of the requirements. Anything else I can check to see if the feature is turned on?
A: You can filter logs on Grafana via these line filter strings:
- Kafka Connect
TaskSchedulerMode=EnabledTaskScheduler: effective Cron expressionTaskScheduler: scheduled successfully
- Event Handler
- if expected that there are scheduled task(s) triggered already
TaskSchedulerService
- if expected that there are scheduled task(s) triggered already
- You can also check the metrics.
Q: How can I check the health of the Task Scheduler?
A: Check the metrics or the app logs in Grafana (Kafka Connect and Event Handler app logs).
Q: What happens if the Event Handler has caught an Exception when processing the scheduled job?
A: You will see an exception raised in the Event Handler app log and also an increment in kafka_bridge_scheduled_task_failure_total. In most cases, you should also see the RPC status code Internal being returned to the Kafka Connect, which can be found in the Kafka Connect log.
Q: What should I do if I can't find the logs in Grafana?
A: You can do the following:
- Double-check and fine-tune the time/date filter on the top right.
- Ensure that you always use label filters:
environment_namegame_namespacecontainerservicefor the Event Handlerkafka-connectfor the Kafka Connect
Q: What should I do if I can't find my metrics in Grafana?
A: You can do the following:
- Fine-tune your Grafana metric queries. If you are using the Builder mode, open the Metrics Explorer, leverage the Grafana auto-filling capabilities and type in
kafka_bridge_scheduledto reveal the ones that had been logged within the time range. - Double-check and fine-tune the time/date filter on the top right.
Q: What should I do if changing my environment variables doesn't seem to take effect?
A: When changing environment variables, always remember to click Restart and Apply.