Out of Memory issues with C# Extend Apps
The .NET C# Extend app uses a garbage collector to automatically manage system memory. However, memory issues may still occur due to:
- Holding references onto large objects for far longer than necessary
- Managed memory leaks
- Unmanaged memory leaks
- General high memory usage
This article contains best practices and a list of recommended tools to use for efficient memory management and mitigate out of memory (OOM) issues in the local development of your .NET C# Extend app.
Best practices
Use appropriate data type. Using
Span<T>wherever possible to reduce the memory usage.Avoid string concatenation since string is immutable. Use
StringBuilderinstead.Limit the amount of data retrieved from other source.
Avoid using unmanaged code. The garbage collector in the .NET C# Extend app does not clean up native resources. Improper implementation of unmanaged code may lead to high memory usage.
Recommended tools
To manage your CPU and memory usage, we recommend using the following tools:
Visual Studio
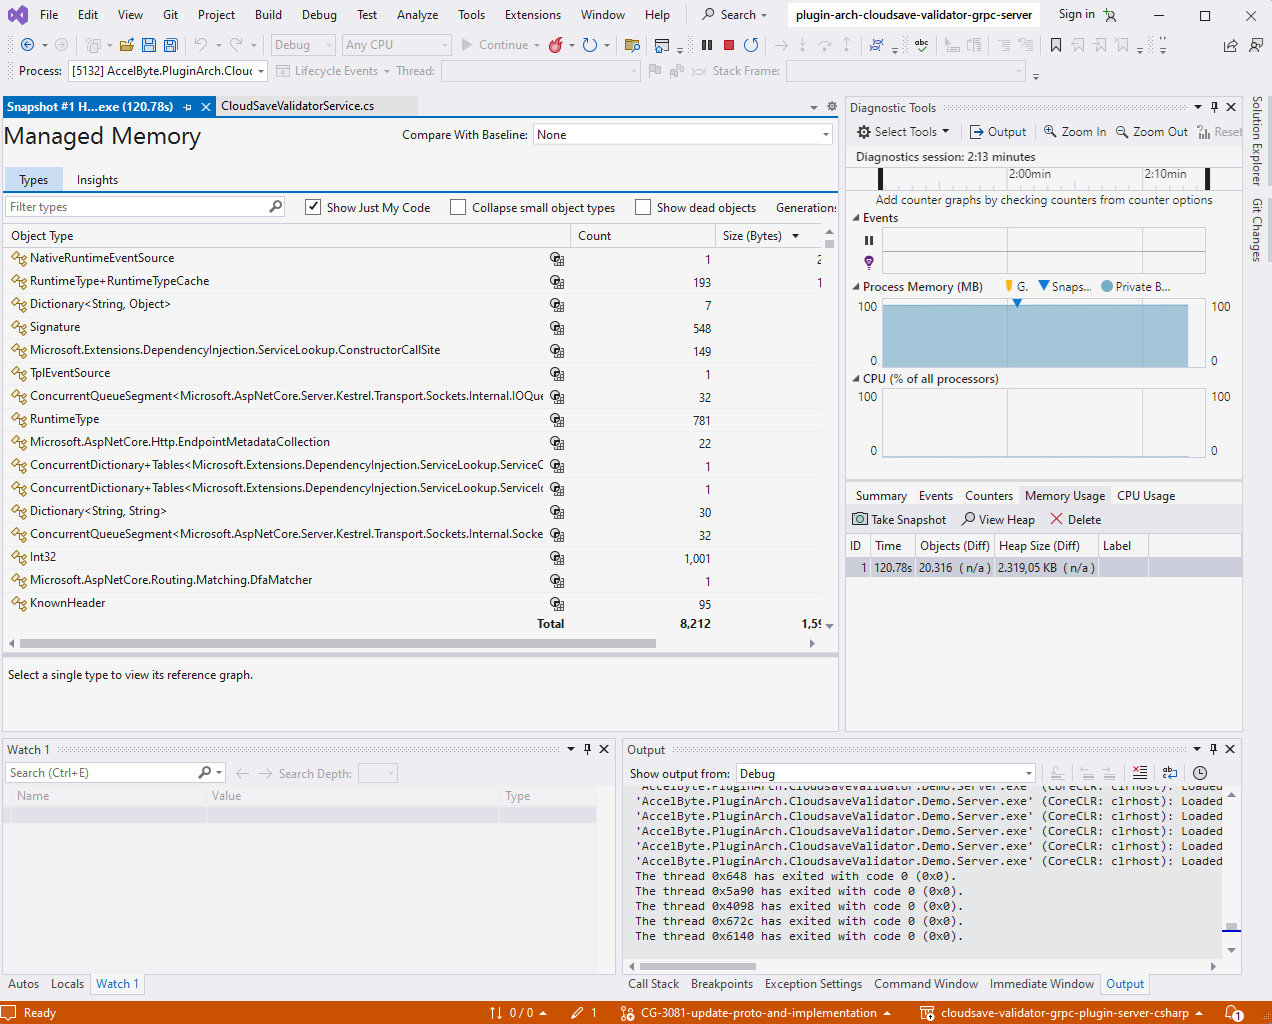
Visual Studio provides great tools to analyze and diagnose memory issues in .NET application.

- Debug the .NET C# application using Visual Studio.
- On the right sidebar, select Diagnostic Tools and pin it. The total process memory will be shown live.
- Go to Memory Usage to take a snapshot and analyze memory usage of your app.
- Go to CPU Usage to view CPU profiling info.
- Click "Enable CPU profiling to see a breakdown of CPU usage by function."
- Put a breakpoint or use break all to see CPU profile.
For more information, refer to Visual Studio's official documentation.
Alternatively, you can use Jetbrains Dotmemory to do CPU and memory profiling for .NET applications. For more information, refer to the official Jetbrains documentation.
Dotnet CLI
Dotnet tools allow you to debug memory leaks on Linux and trace high CPU usage.