Can't See a Call Stack From an Unreal Editor Crash
Overview
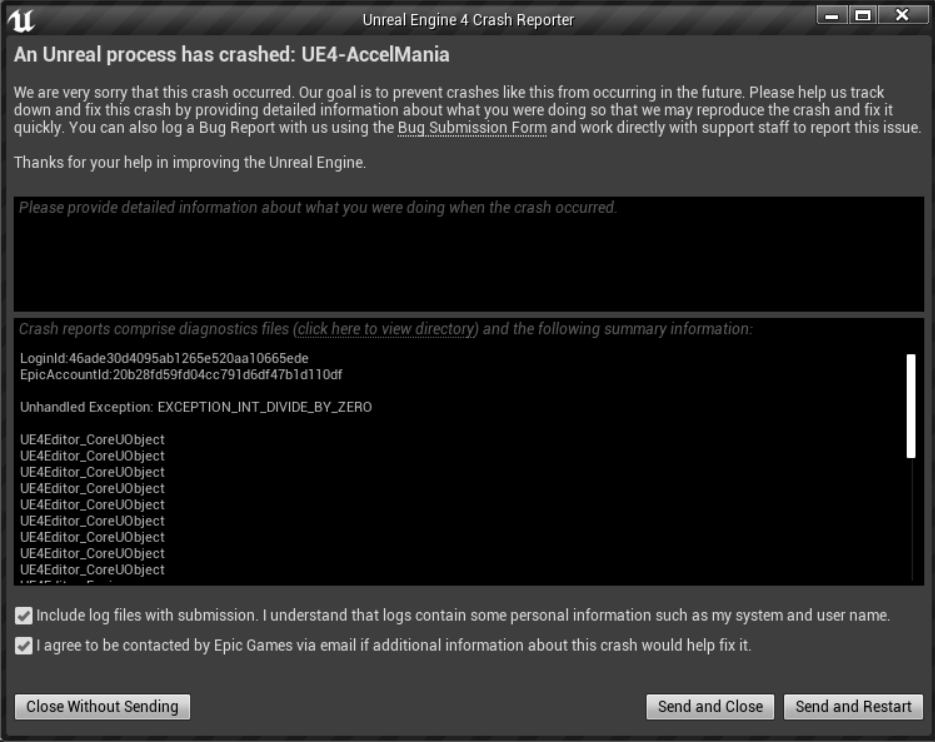
Here we will look at a solution for instances where you have a crash while using the Unreal Editor, and you can't see a call stack in the AccelByte Development Toolkit's (ADT) Crash Reporter. Instead of showing the full call stack, Crash Reporter just shows a bunch of lines saying UE4Editor_CoreObject.

When this crash is sent to the ADT server, we still can't get full debug information because we have no PDB symbol file, so the stack trace will look like this:

What is missing here is all the debug information for Unreal Editor itself that is needed to build a stack trace during a crash within Unreal Editor.
This is easy to find, we just need the correct setup in Unreal Editor. Let's fix it here.
So let's make sure you have the Unreal Editor PDB symbol file within the Unreal Editor binary itself. The easiest way to do this is using the Epic Launcher, so let's look at that first.
Download Unreal Engine from Epic Launcher
If you are using Unreal Engine from the Epic Launcher, you can download the PDB symbol file that's needed to parse the call stack.
-
In the Unreal Engine menu, select the Library tab. Here you will see the Unreal Engine version that is installed on the local machine.
-
Click the drop-down arrow beside the Launch button, then choose the Options menu.

-
Check the Editor symbols for debugging option.
-
Click Apply. It may take a while to download the PDB symbol file as it can be pretty huge, but you only need to do this once.

Download Unreal Engine from GitHub
If you are using Unreal Engine from GitHub, you only need to compile the Unreal Engine to generate the new PDB symbol file.
But, if you get the same error whilst using the Unreal Editor, recompile the Unreal Editor on the local machine. Sometimes when you work on a collaboration repository, someone may have committed the Unreal Editor executable but excluded the PDB symbol file.
We're all done. You should now get your call stack on any Unreal Editor crashes moving forward.