Debug using Microsoft symbol server
Overview
Microsoft symbol server is a Windows technology used to obtain symbol debugging information. It will help you find the appropriate symbol (PDB) from the minidump you want to debug.
AccelByte Development Toolkit (ADT) has a symbol server, which enables you to download minidump from the website and use Visual Studio to debug it without having the PDB file.
We recommend using Visual Studio as your IDE, but you can use any IDE you prefer.
Prerequisites
- An Admin or Developer account in ADT Web.
- An ADT IAM account.
- ADT Symbol client proxy
- GNU Make
Set up client Proxy
-
Download the ADT Symbol client proxy from the download page in ADT Web.
-
Open the downloaded folder and run the terminal.
-
Run this command in the CLI.
.\client-symbol-proxy-v0.2.1-win64.exe login -
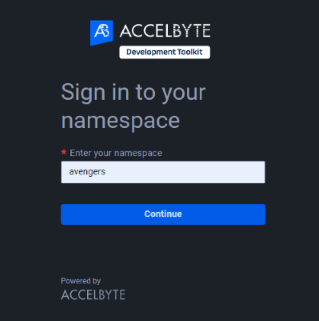
A browser window will open and redirect you to the ADT Login page. Type in your namespace and select Continue.
-
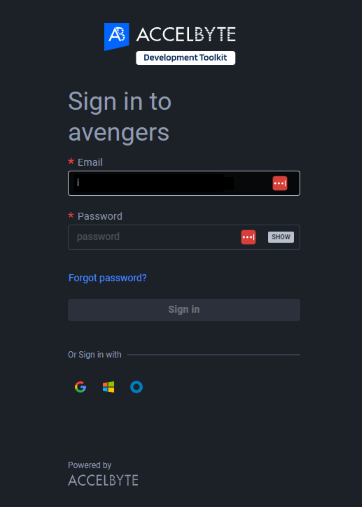
Log in using your ADT credential or SSO.
-
The CLI will confirm if you have successfully logged in.
    PS D:\SymbolServer> .\client-symbol-proxy-v0.2.1-win64.exe login
    time="2023-10-23T13:52:31+07:00" level=info msg="Client is running at http://localhost:9094"
time="2023-10-23T13:53:18+07:00" level=info msg="Login success" -
Run this command in the CLI.
.\client-symbol-proxy-v0.2.1-win64.exe serveThe response should be as follows:
time="2023-10-23T13:57:38+07:00" level=info msg="serve port :8080"This means that the client proxy is ready.
Debug in Visual Studio
Follow these steps:
-
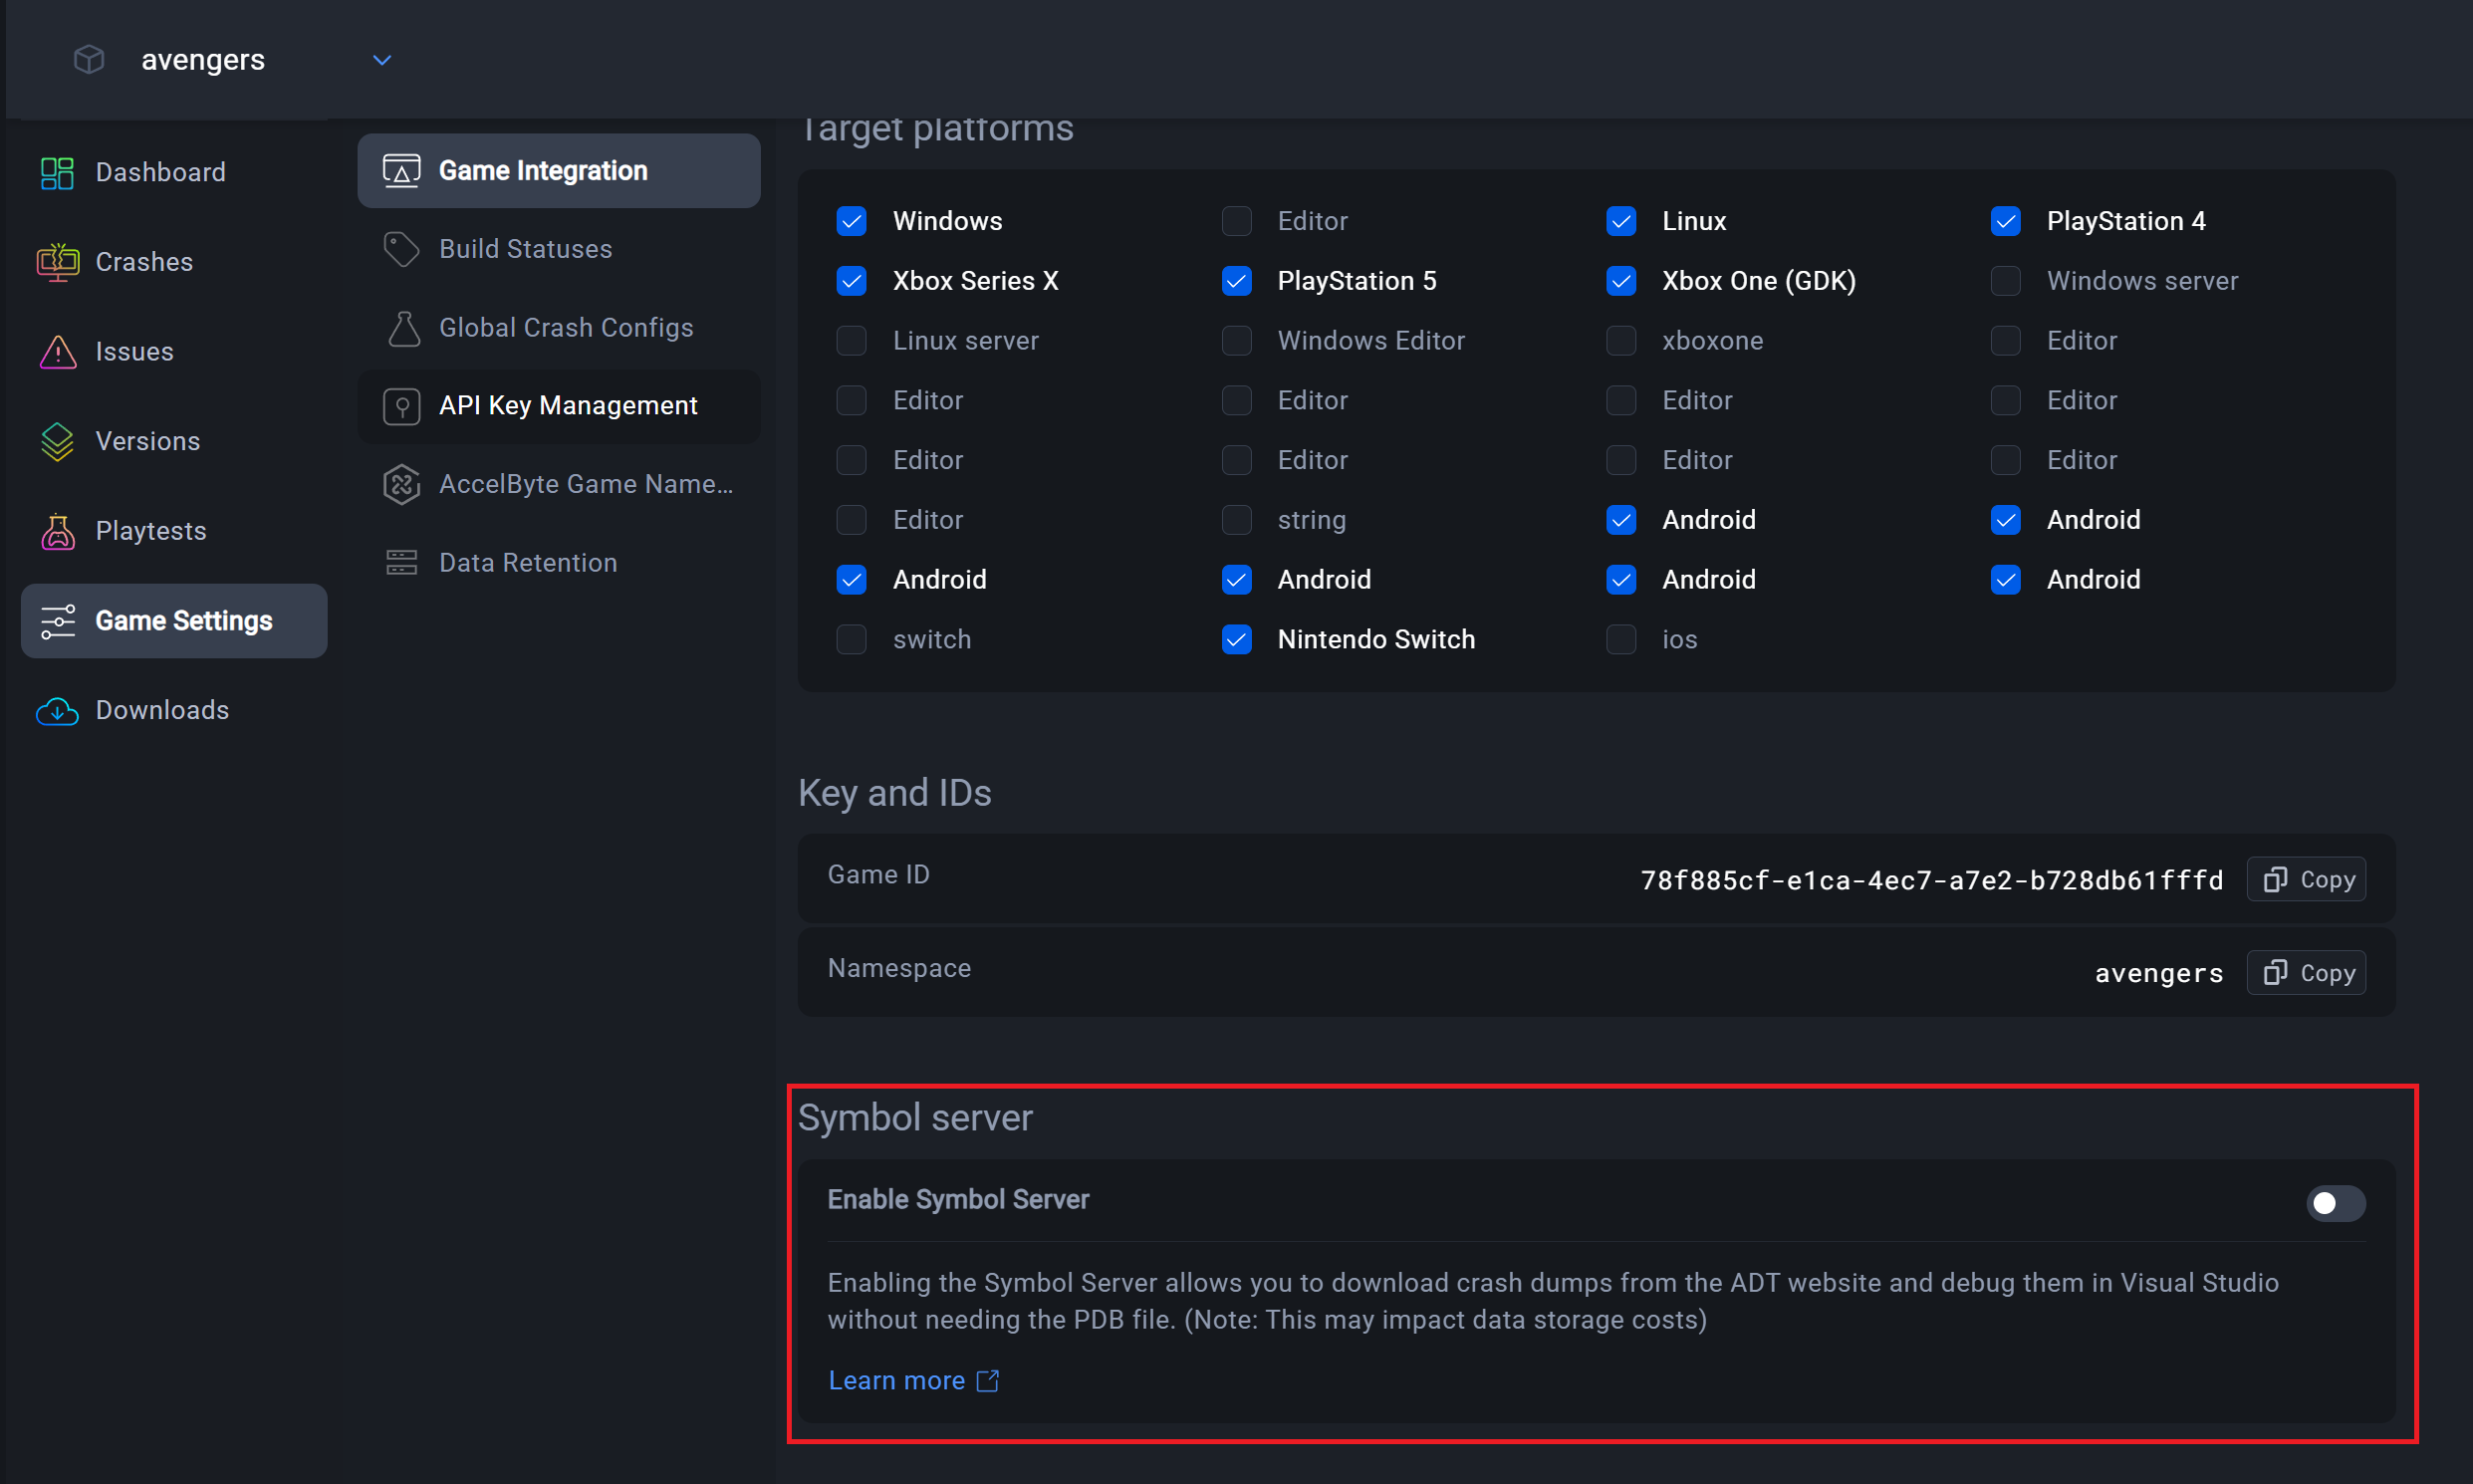
Navigate to Game Settings → Game Integration in ADT and enable the Symbol Server to allow symbol retrieval during debugging.
-
Download the minidump from the ADT Crash details page.
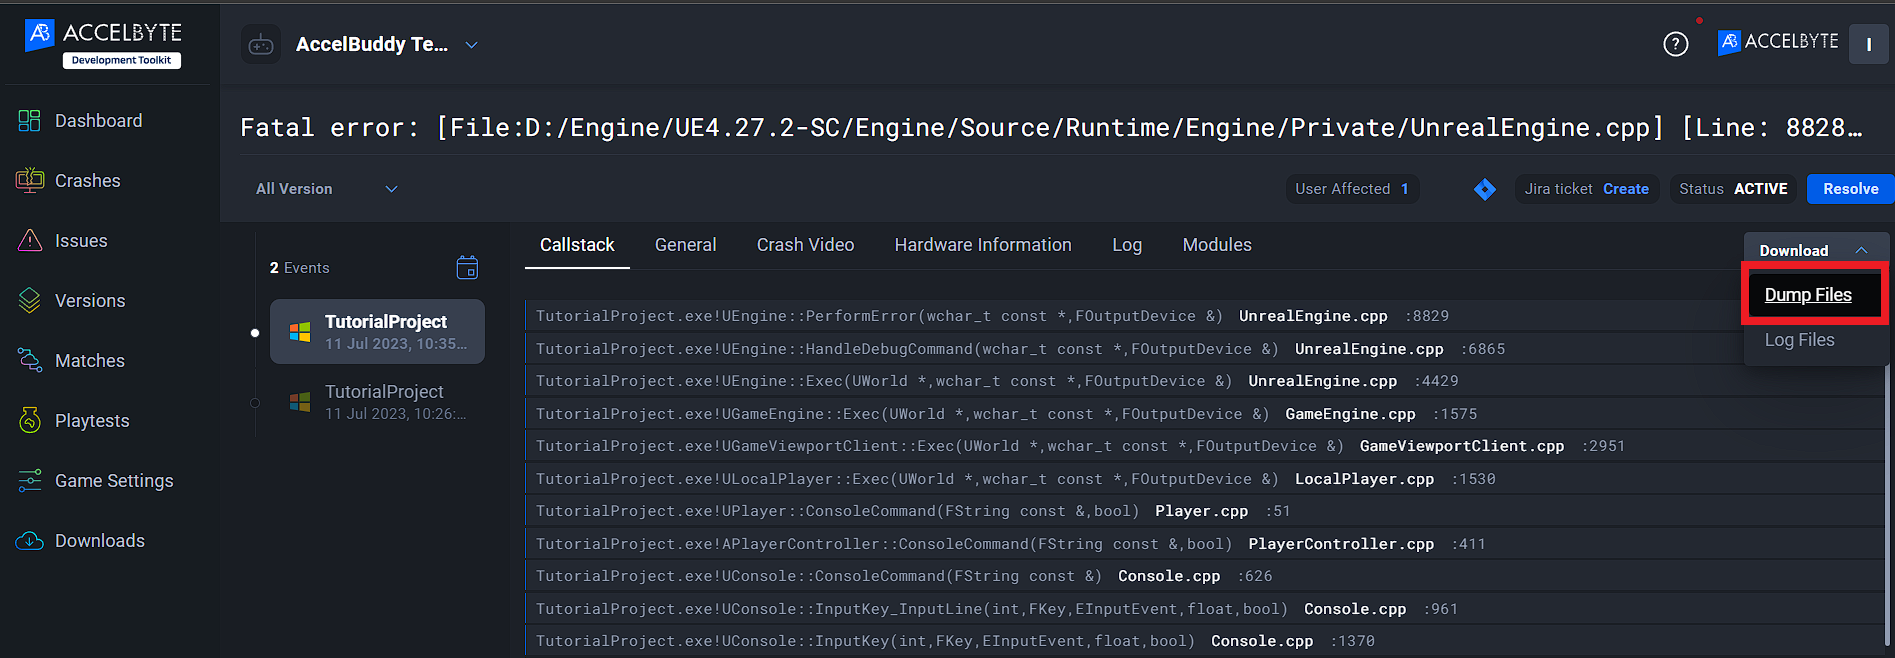
-
Open the DMP file with Visual Studio.
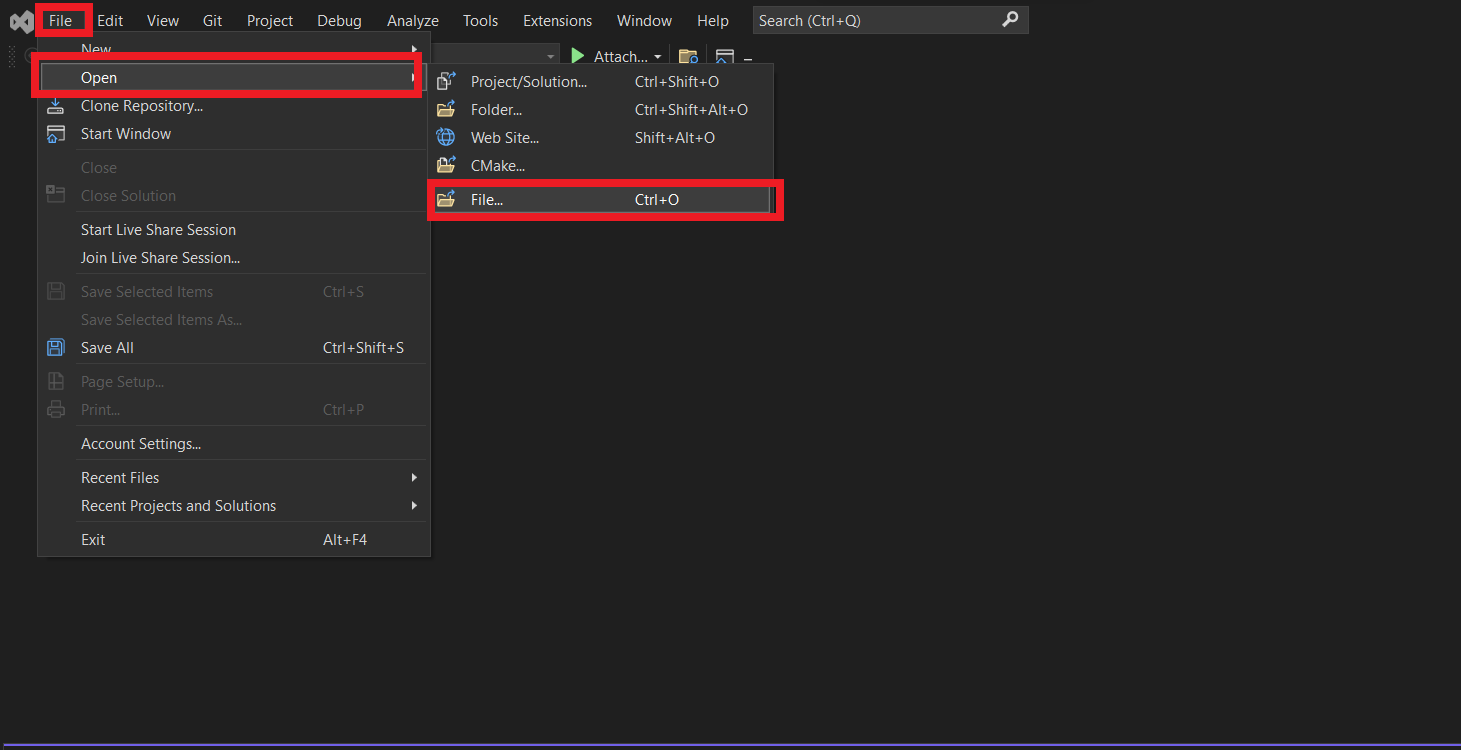
-
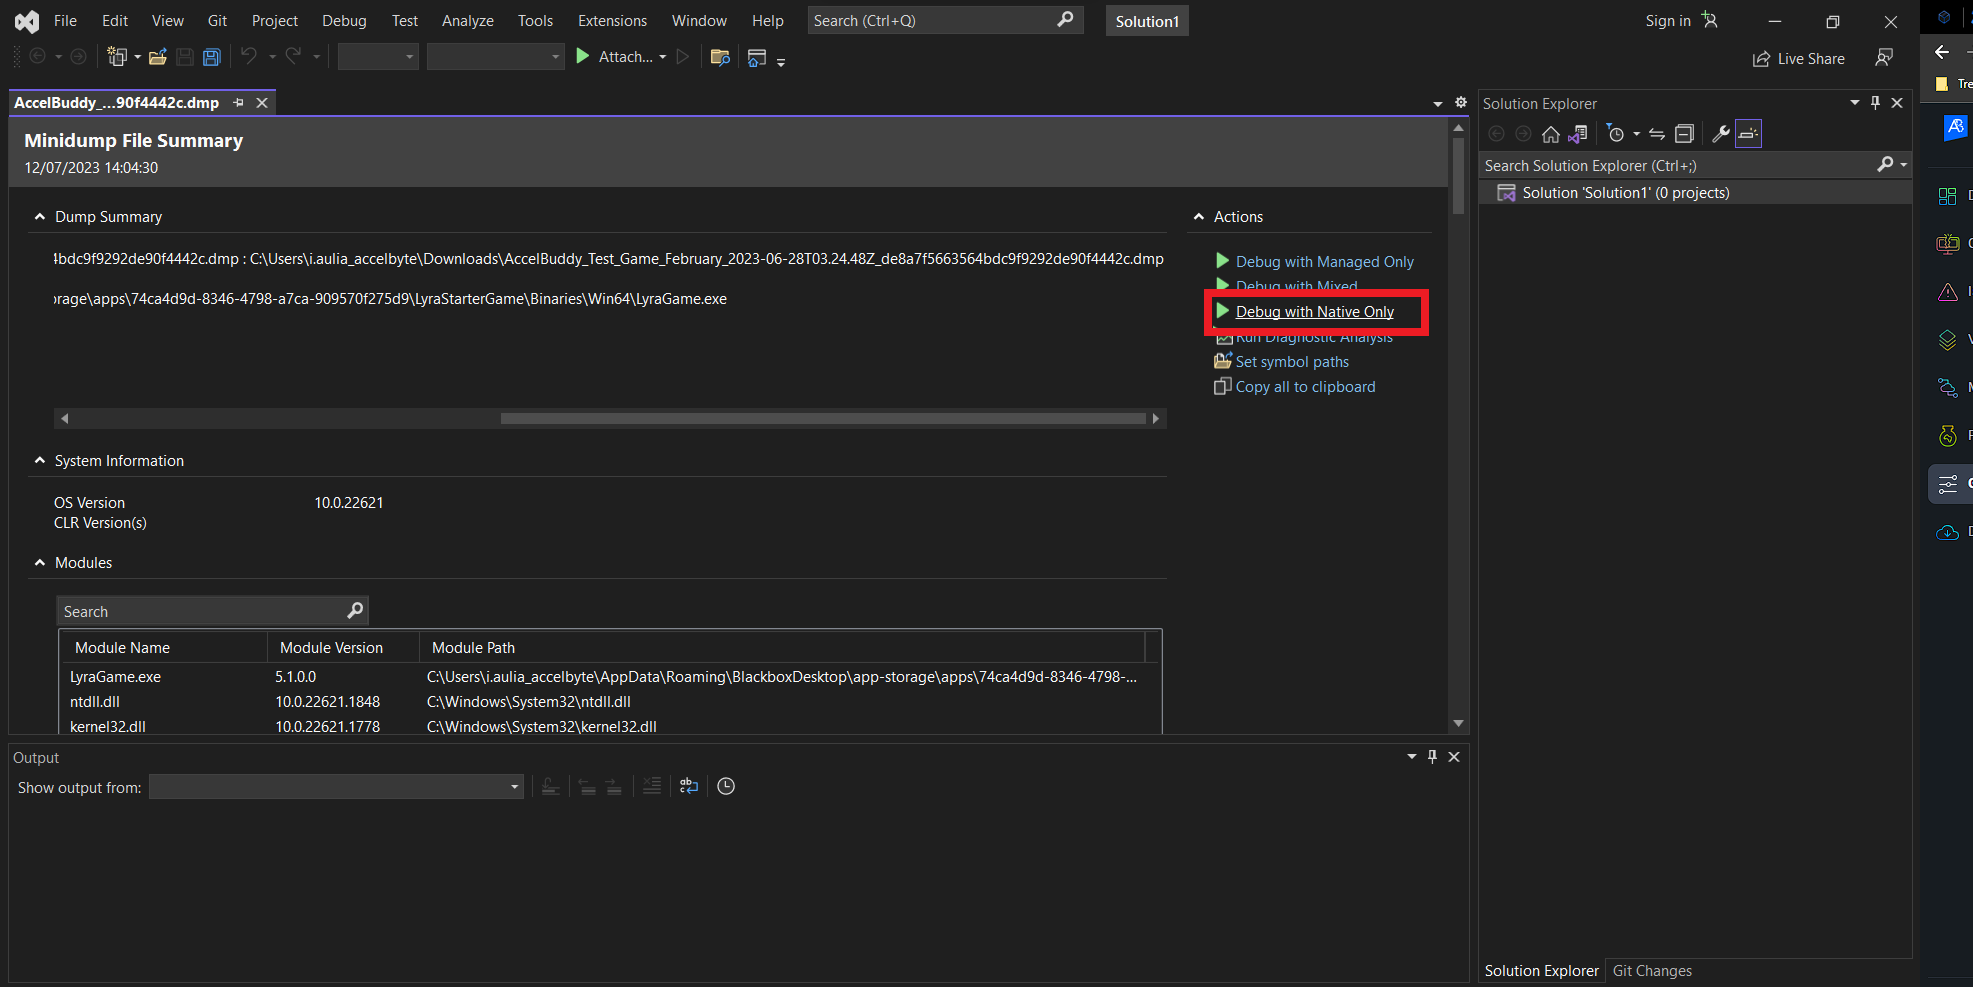
The debugging window appears. Click on the Set Symbol Paths button.
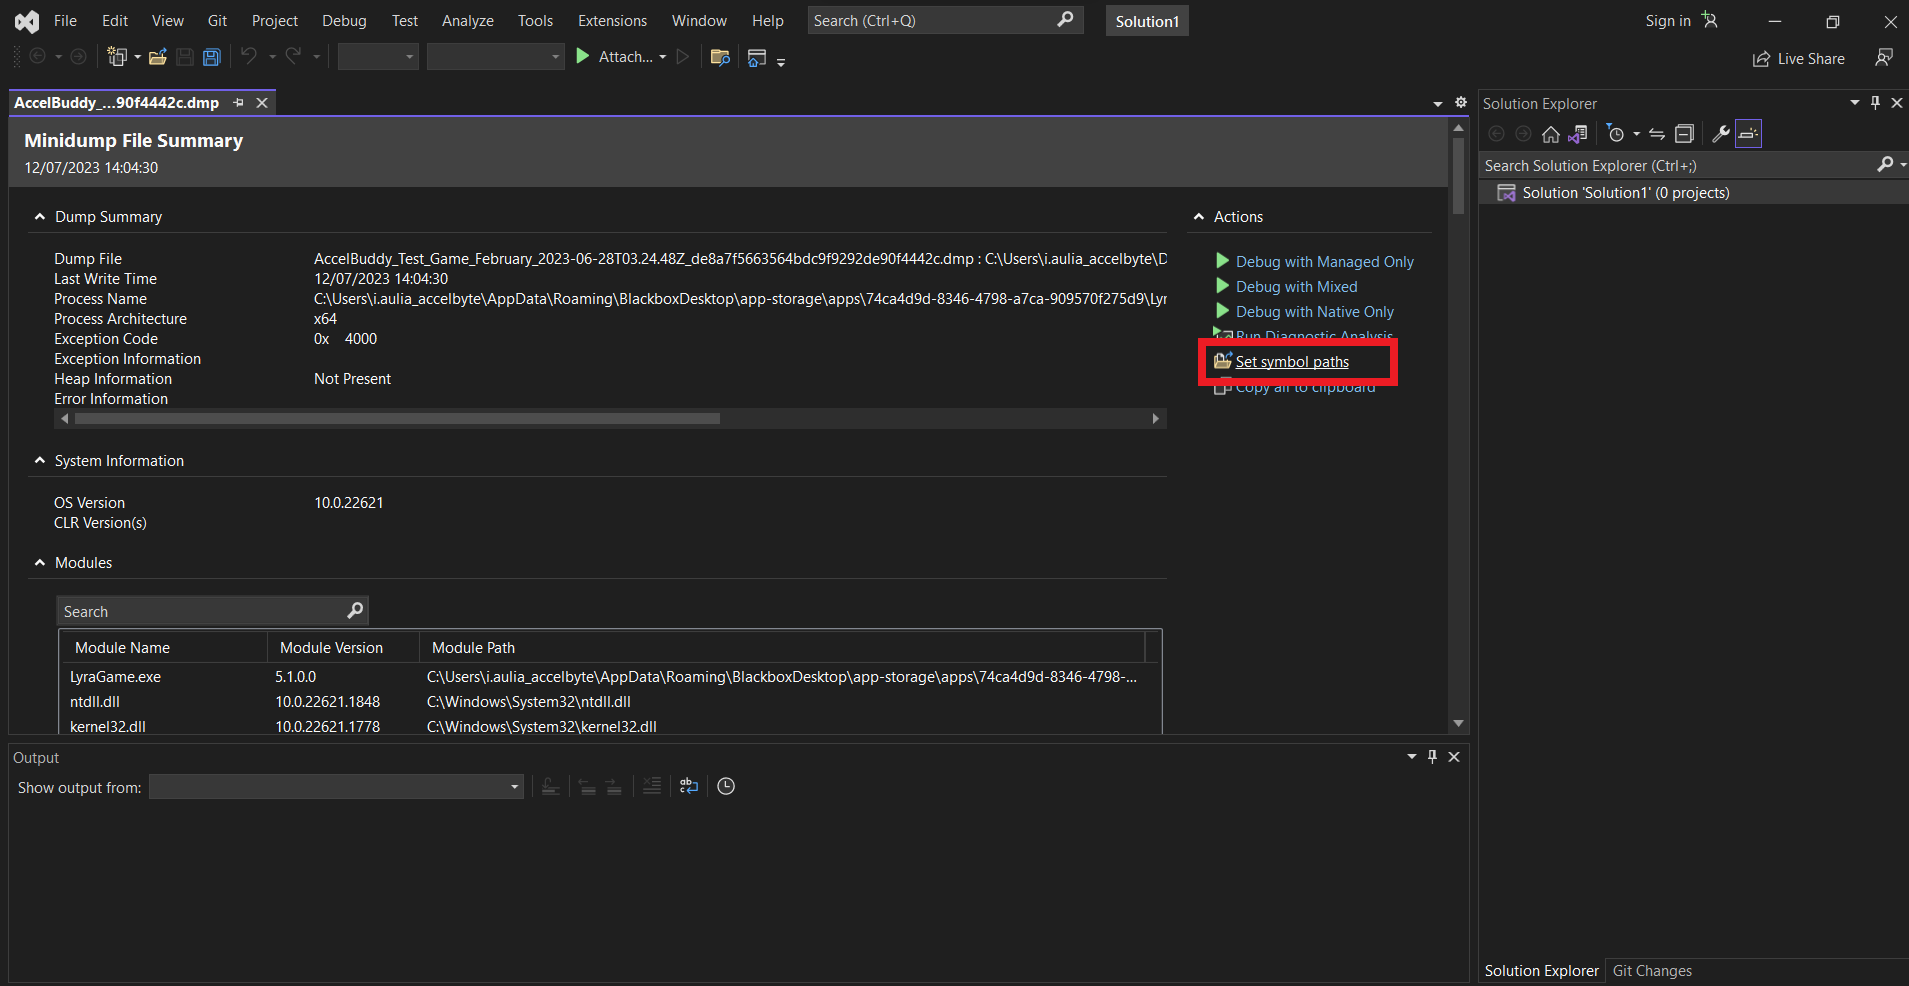
-
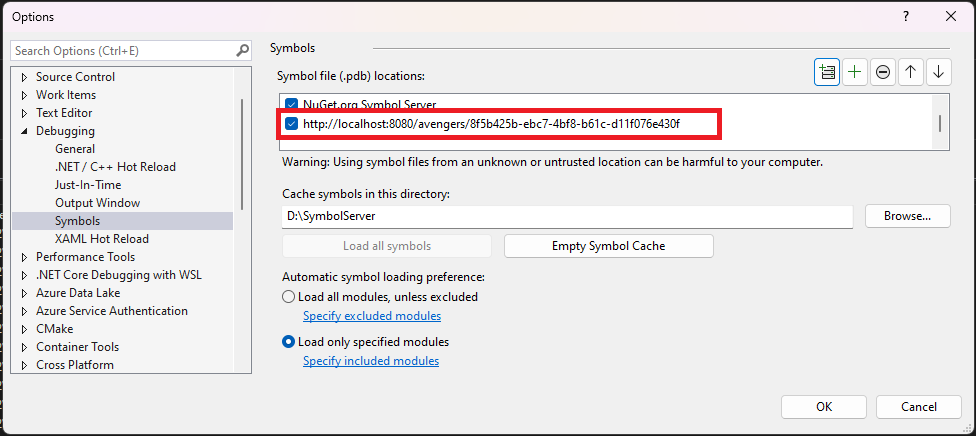
The Options window appears. Click the plus (+) button.
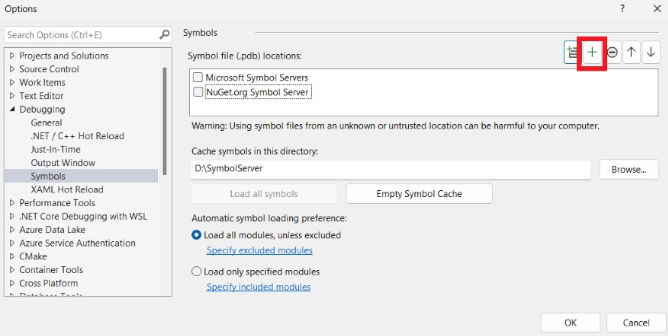
-
A new entry for the symbol server will be created. In the textbox, type in the local host.
http://localhost:8080/<NAMESPACE>/<GAME_ID>Tick the checkbox, then click the OK button.
-
Click Debug With Native Only to start debugging.
