Basic Profiling
Overview
It's really easy to have AccelByte Development Toolkit (ADT) obtain basic performance profiling for your game. For basic profiling, you get access to GPU and CPU frame cost and frame time in milliseconds, total memory available, and total memory used. You can use all these values to help understand your game's performance. This guide will show you how to set up basic profiling.
Prerequisites
To run basic profiling, you first need to integrate the ADT SDK into your game.
Set up basic profiling in your game
Follow the steps below to profile your game performance:
-
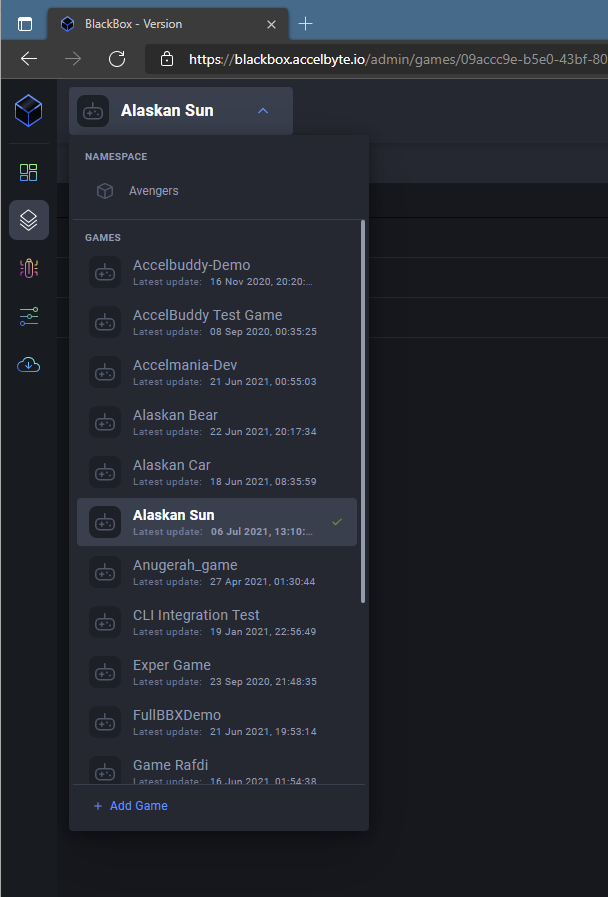
In ADT Web, select the game you want to profile from the dropdown.
-
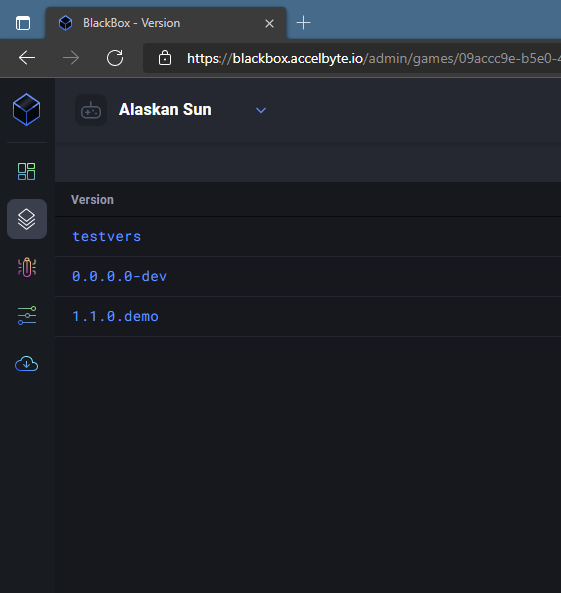
Select the game version.
-
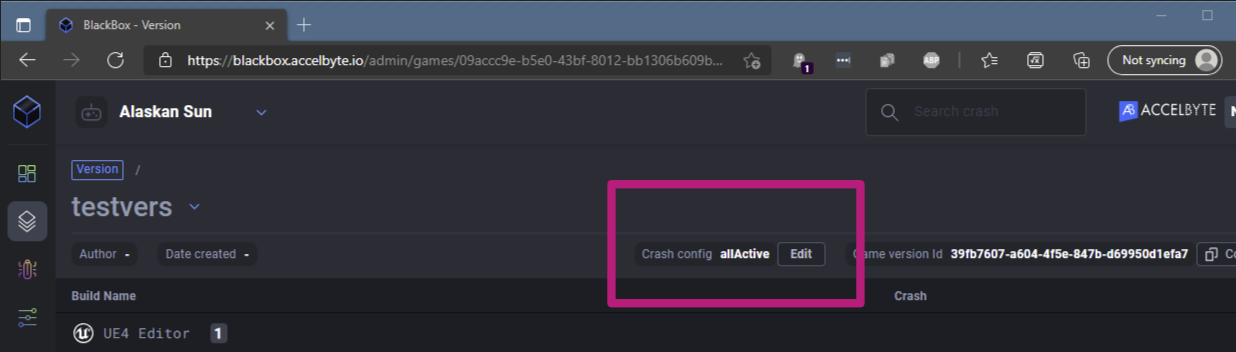
If you do not have a Crash config for that version yet, add one now. After you add one, the Edit Crash Config page is displayed.
-
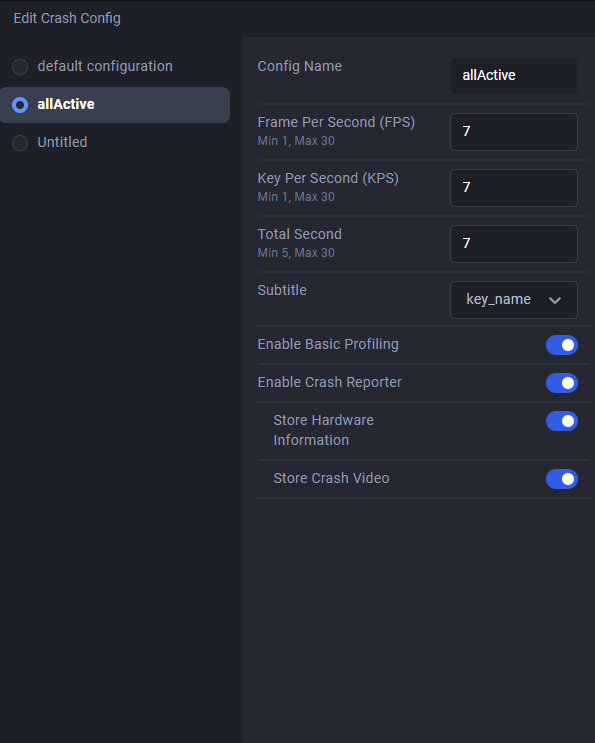
Turn on the toggle button of the Enable the Basic Profiling option.
-
Play your game for at least 10 seconds to allow ADT to profile the selected functions of the game.
-
Close or crash the game.
-
Open the Versions tab in ADT Web.
-
Select your game version.
-
Select the build session you want to see profiling data for. The session that has basic profiling available has a green tick next to it.
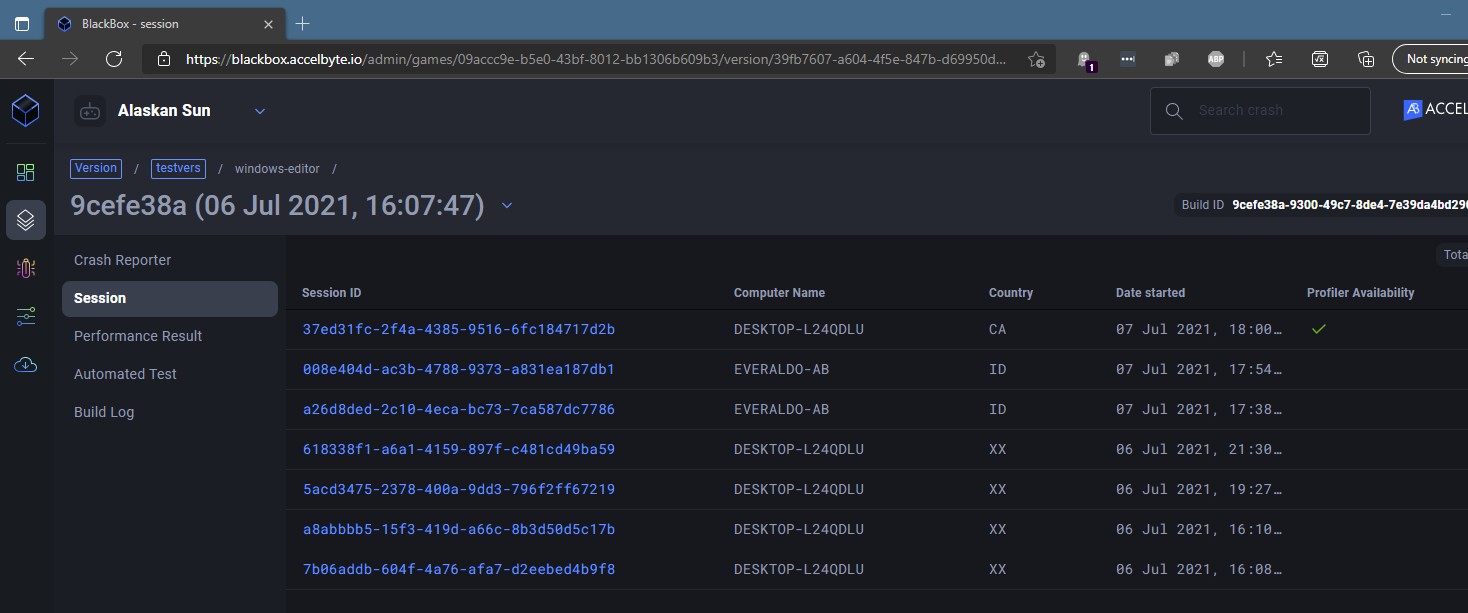
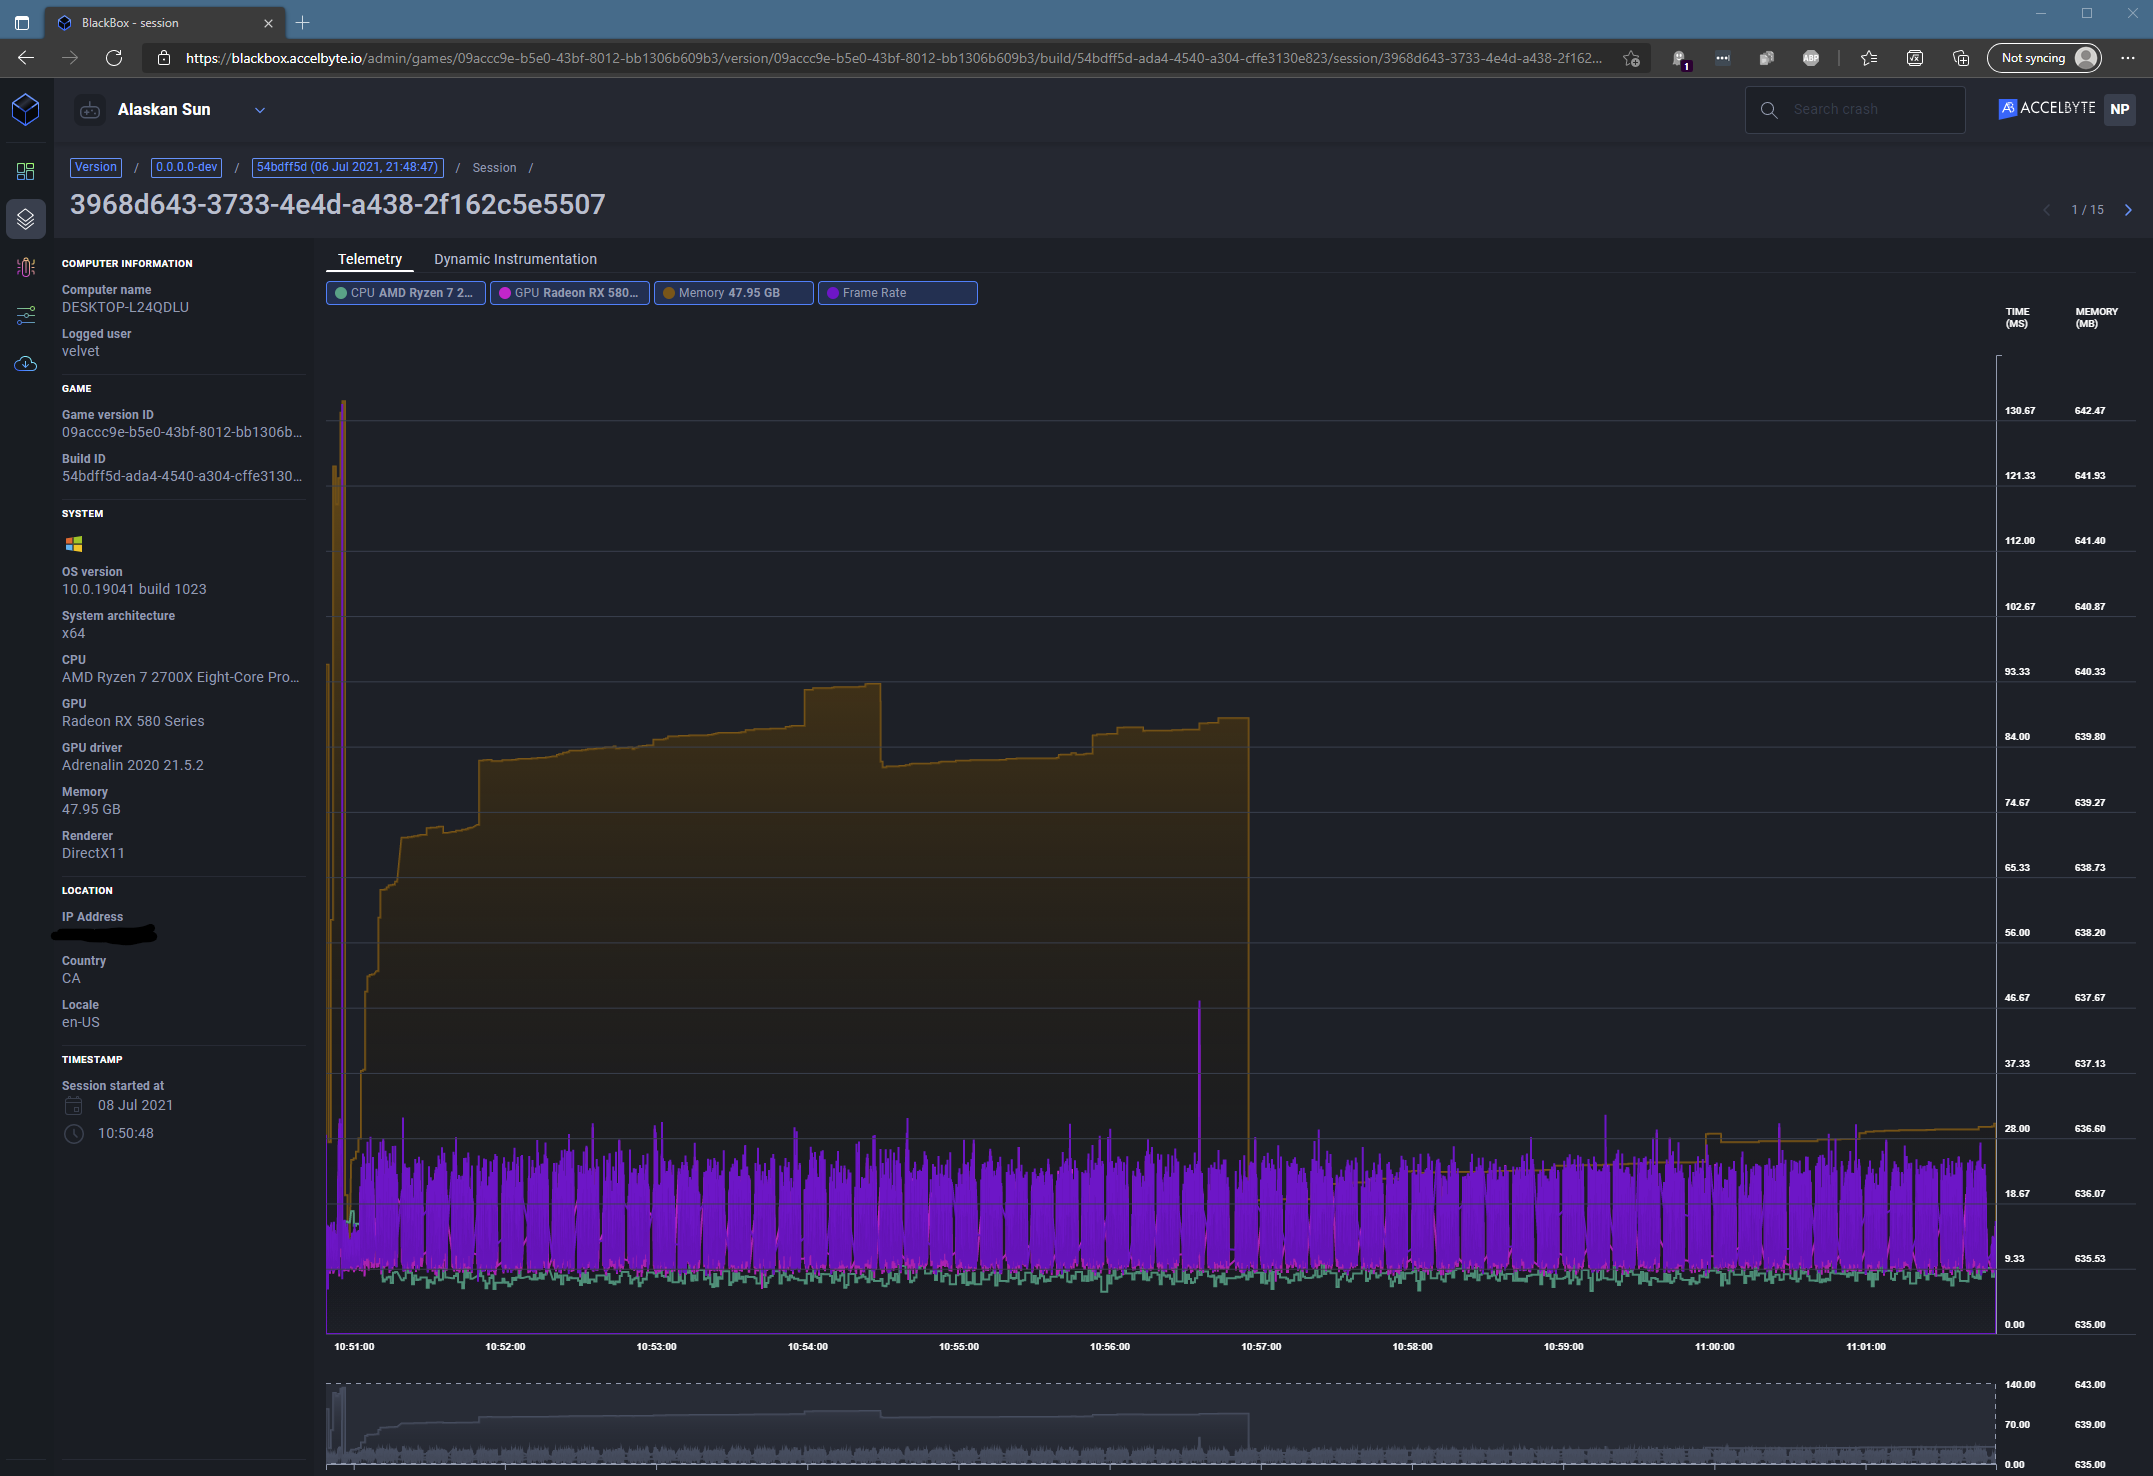
The basic profiling for the selected session is displayed.
-
Toggle the four metrics to focus in on what you want. On the mini graph at the bottom you can mark out a time window and scroll through the data.