How to Enable and Use FPS Drop Detection
Goal
Set up automatic FPS drop detection in your Unreal Engine project on Windows so that every Development build session captures frame rate drops with video clips, thread profiling data, and player context -- viewable in the ADT dashboard after the session ends.
Prerequisites
-
ADT SDK installed and initialized in your Unreal Engine 5.0+ project. The SDK must be at the version that includes the FPS Drop Reporter module. See the ADT SDK integration guide for setup instructions.
-
ADT namespace with the
fps-drop-detectionenabled via Labs by a namespace admin. See Step 1 below. -
Development build configuration -- FPS Drop Detection is stripped from Shipping builds automatically. Your build must use the Development configuration.
-
Network access -- the machine running the game must be able to reach the ADT backend at session end for uploading FPS drop data.
-
ADT Hub installed on the development machine (required to see upload progress).
Steps
Step 1: Enable the Feature in Labs Settings
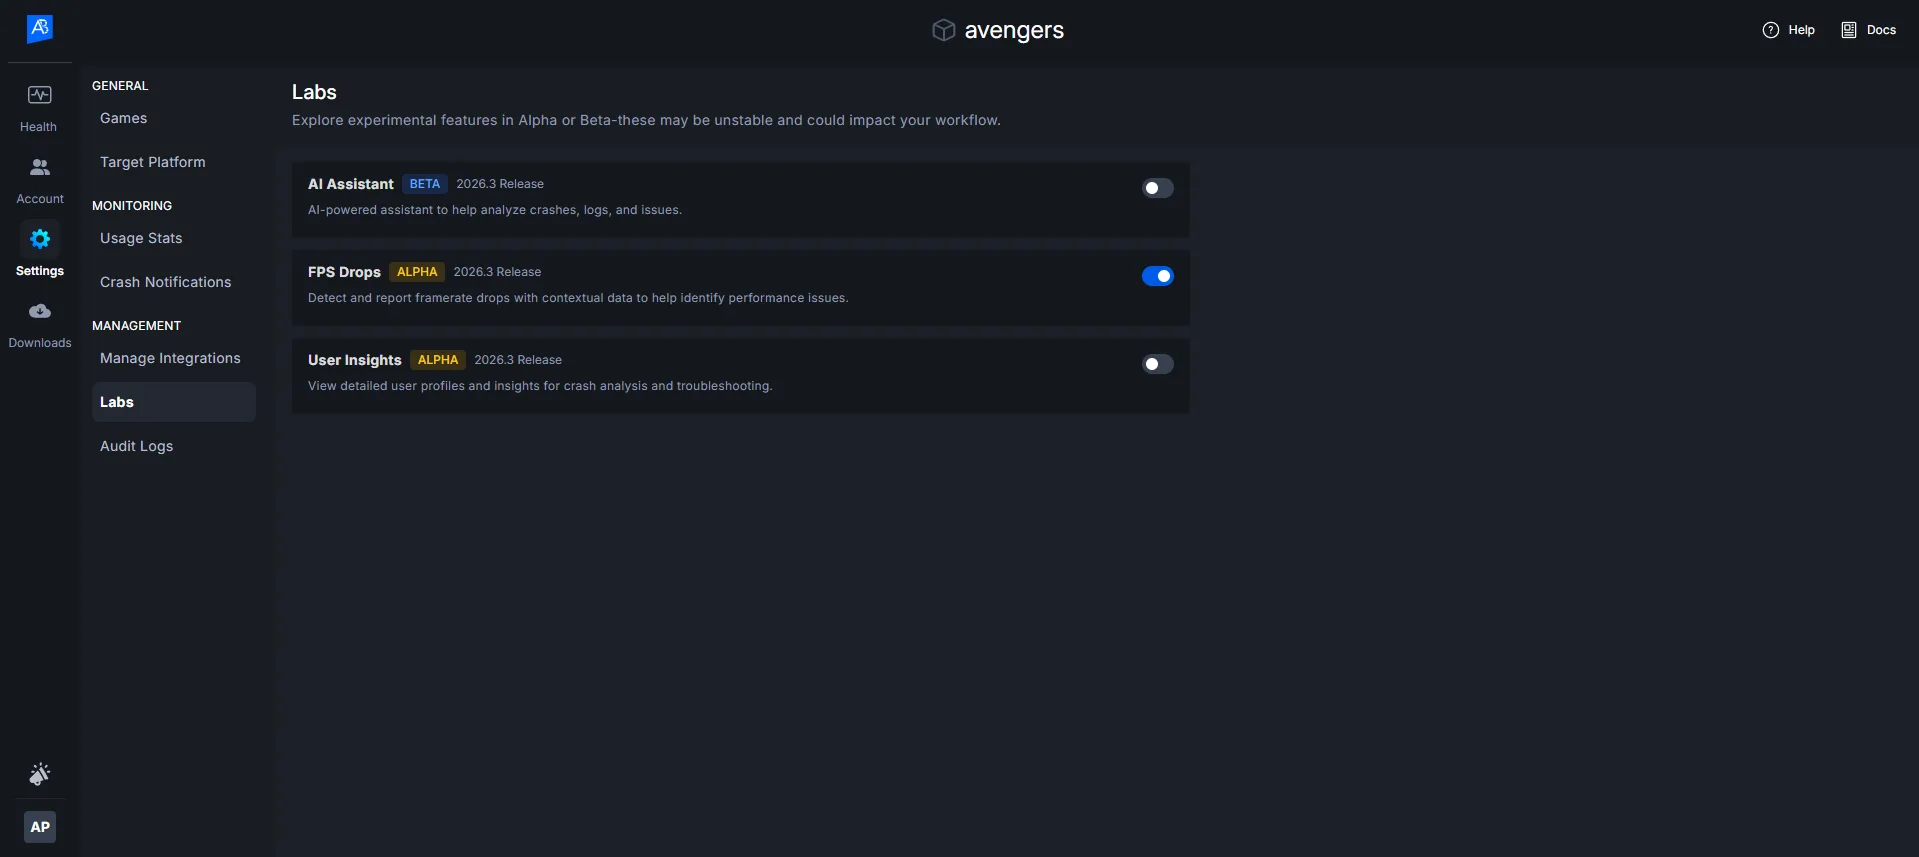
FPS Drop Detection is gated behind a Labs toggle. A namespace admin must enable it before the feature becomes available.
-
Open ADT Web and navigate to Namespace Settings.
-
Go to the Labs section.
-
Find FPS Drop Detection in the list and enable it.
-
Confirm the activation in the dialog that appears.
Once enabled, the FPS Drop Detection UI elements appear across the dashboard: the FPS Drop sidebar item, the FPS Drop Reporting settings section, and FPS drop markers on the Flight Recorder timeline.
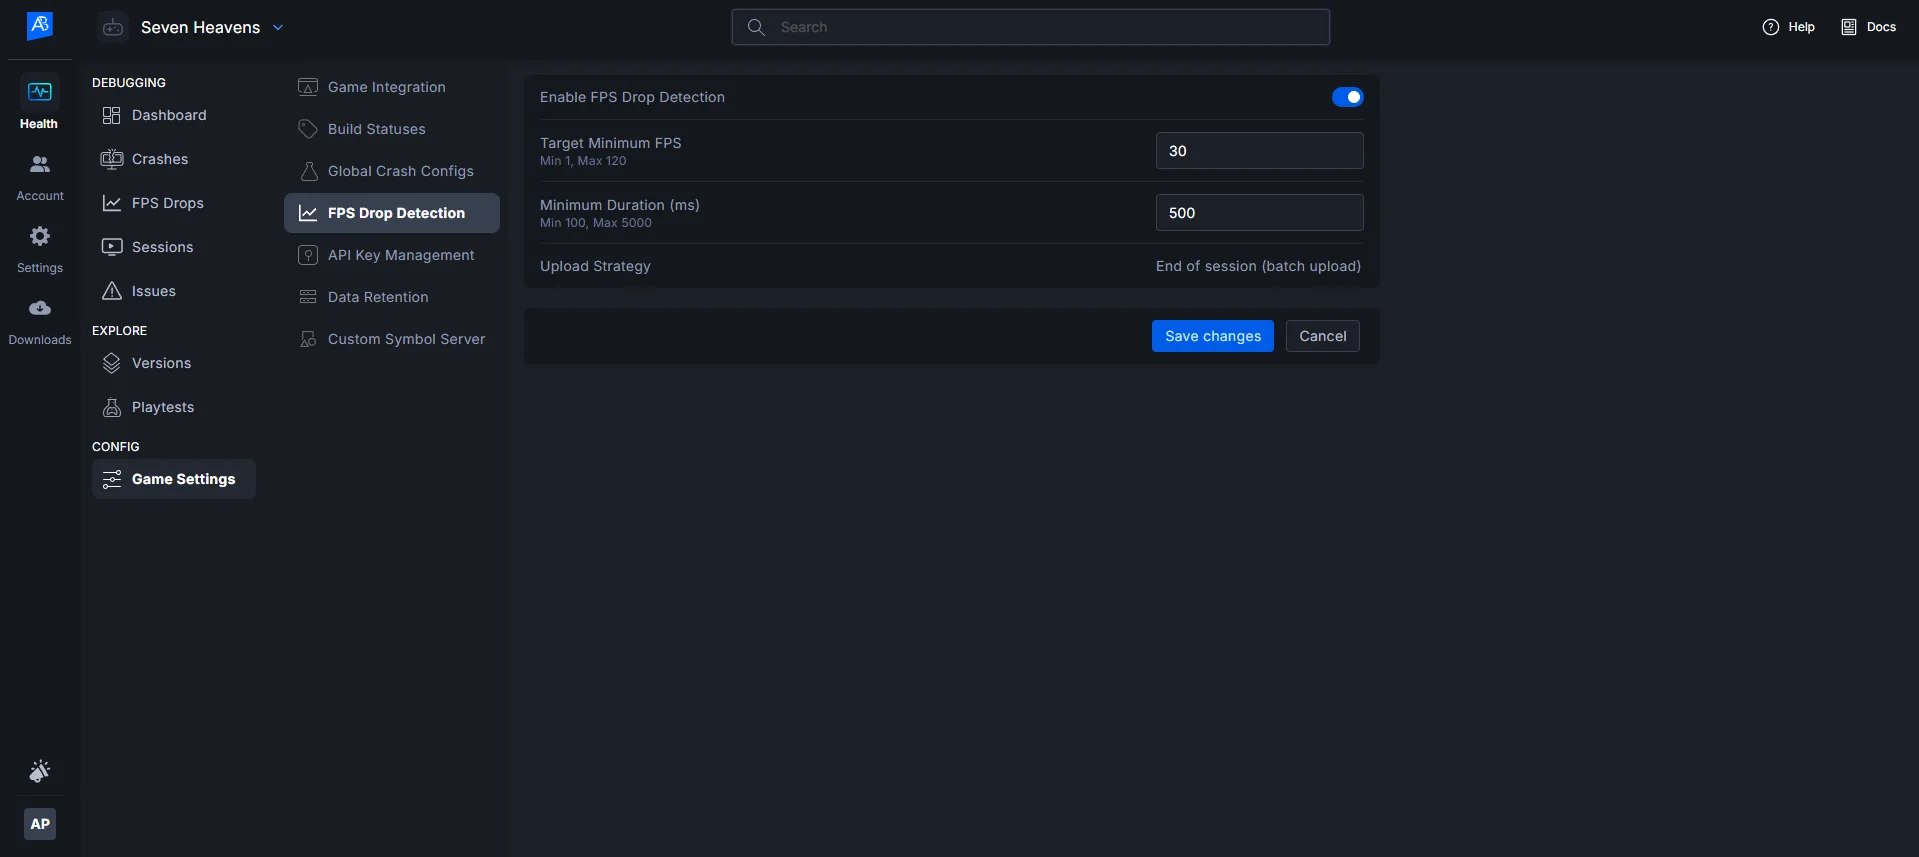
Step 2: Configure detection thresholds
-
In ADT Web, navigate to Project Settings.
-
Locate the FPS Drop Detection section.
-
Toggle FPS Drop Detection to On.
-
Set the detection thresholds:
-
Minimum FPS -- the frame rate below which the system starts tracking a potential drop. Default: 30. Accepts integers from 1 to 120.
-
Minimum Duration (ms) -- how long the frame rate must stay below the threshold before a drop is confirmed. Default: 500. Accepts integers from 100 to 5000.
-
-
Click Save.
The Upload Strategy field displays "Queue until Session End" and is not editable. All FPS drop data uploads happen after the session ends.
FPS Drop Reporting is active in Development builds only. It is automatically disabled in Shipping builds.
Step 3: Run a Development build session
No additional code is required. The ADT SDK automatically begins monitoring frame times when a new session starts.
-
Launch your game in a Development build configuration.
-
The SDK calls
bbx_start_new_session()on startup, which fetches the FPS drop reporting policy from the server. -
Play through areas where you expect or want to test for performance issues.
-
The SDK monitors every frame in the background. When it detects a sustained FPS drop matching your configured thresholds, it automatically:
-
Dumps a 10-second video clip from the ring buffer
-
Captures GameThread, RenderThread, and GPU timing data
-
Records the current level/map name and player coordinates
-
Writes the payload to a local queue on disk
-
You do not need to trigger, annotate, or interact with the detection system during gameplay. It runs silently with less than 0.1ms per-frame overhead.
Step 4: End the session and upload
When the session ends, the SDK automatically uploads all queued FPS drop data.
-
Exit the game normally (the SDK hooks into
EndPlay) or return to the Main Menu. -
ADT Hub displays an upload progress panel in the lower-right corner showing:
-
Number of FPS drop payloads queued vs. uploaded
-
Video clip upload progress (e.g., "Video 2 of 3 uploading...")
-
Overall completion percentage
-
-
Wait for the upload to complete. The panel shows a success summary when finished.
The upload progress panel is non-blocking. You can continue using ADT Hub while the upload proceeds. Do not close ADT Hub until the upload completes.
If any uploads fail after 3 retries, the panel shows the number of failed payloads and a Retry All Failed button. Failed payloads are also automatically retried on the next session start.
Step 5: Review FPS drops in the dashboard
Once the upload completes, FPS drop data is available in ADT Web.
Check the Sessions List:
-
In ADT Web, navigate to Sessions.
-
The FPS Drops column shows the count of confirmed FPS drop events per session.
-
Sessions with FPS drops display a yellow warning badge. The session status shows:
-
Clean -- no FPS drops, no crashes
-
Has FPS Drops -- FPS drops detected, no crash
-
Crashed -- session crashed (takes precedence even if FPS drops also occurred)
-
-
Use the status filter to show only sessions with FPS drops.
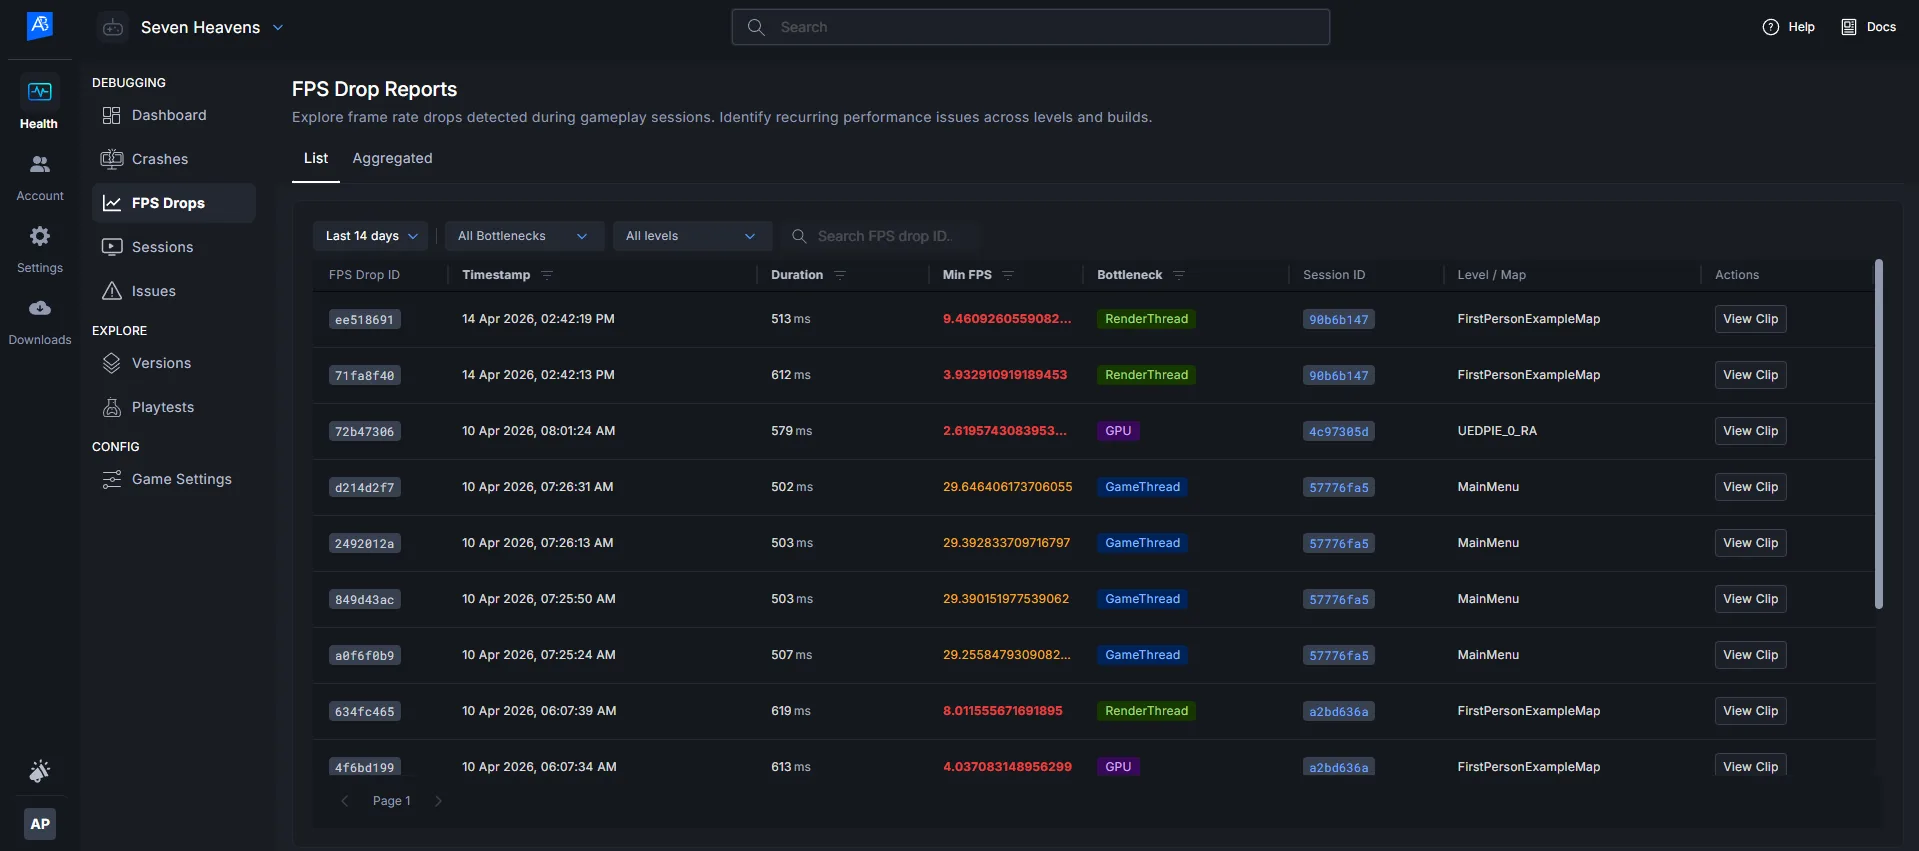
Browse the FPS Drops List:
- Navigate to FPS Drops in the sidebar (appears between Crashes and Issues).
-
The FPS Drops List shows all individual FPS drop events with columns: Timestamp, Session ID, User, Level/Map, Duration, Min FPS, Bottleneck, and Build.
-
Use filters to narrow by Bottleneck Type (GameThread / RenderThread / GPU), FPS Drop ID, Level/Map or Date Range.
-
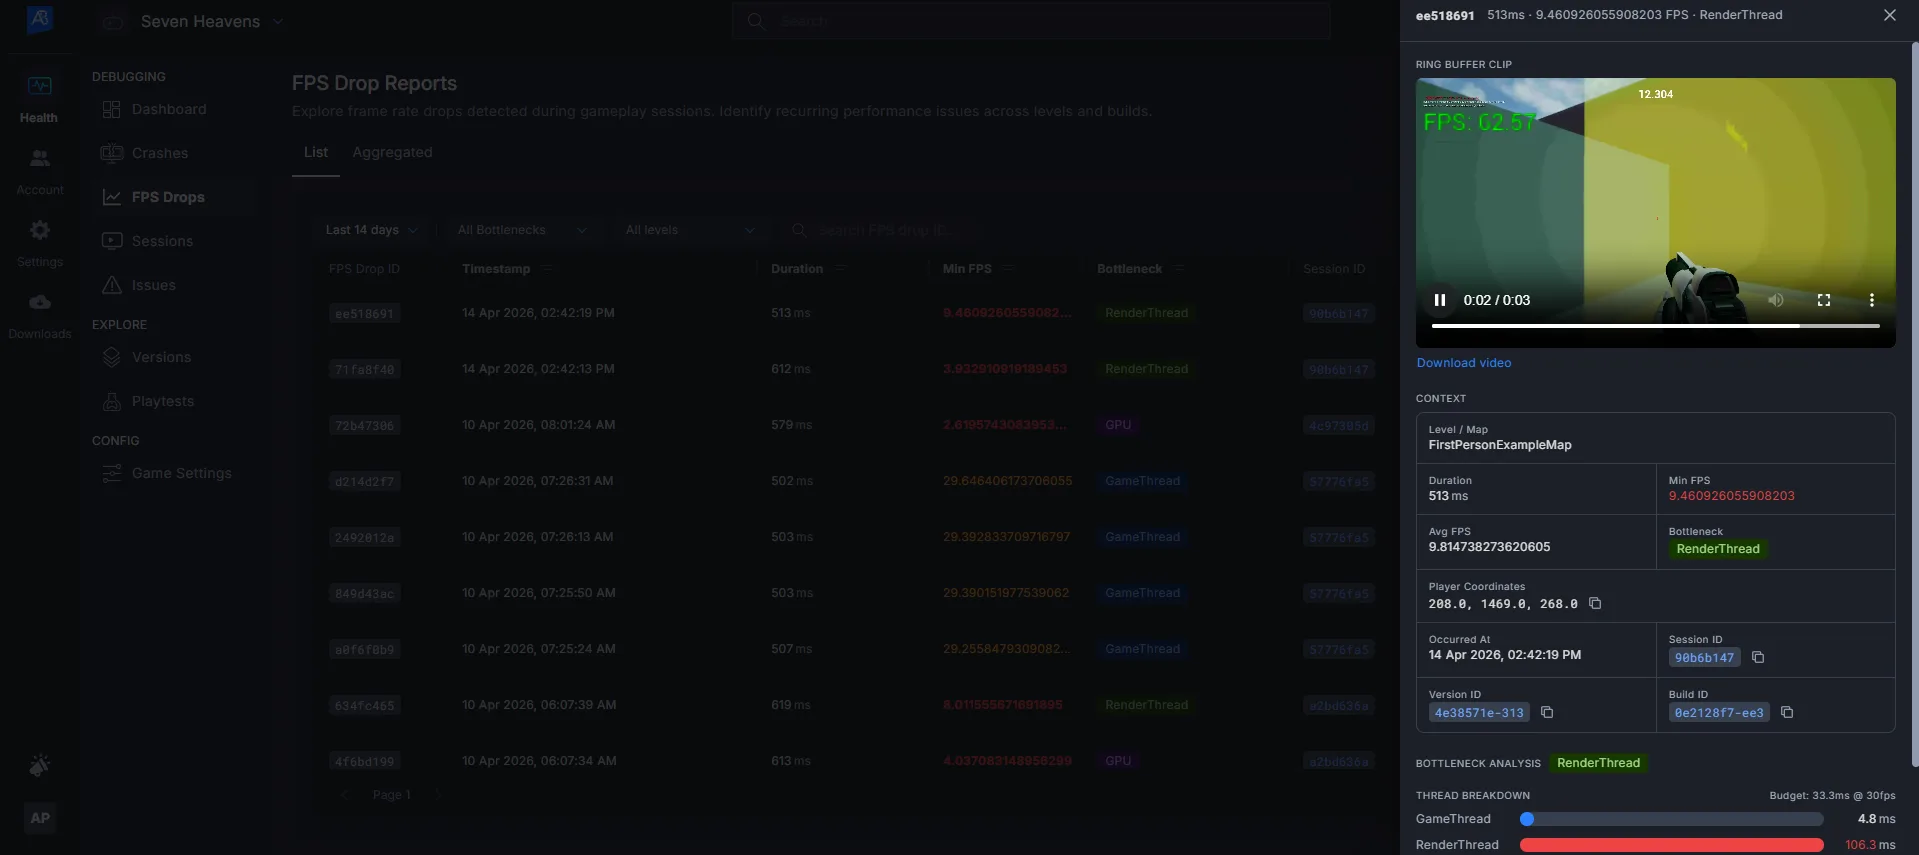
Click View Clip on any row to open the Inspector Panel with the 10-second video, stat breakdown, and player context.
Identify hotspot areas with the Aggregated View:
-
Navigate to FPS Drops > Aggregated.
-
FPS drops are grouped by Level/Map, showing: average FPS drop, minimum FPS recorded, occurrence count, affected users, and build.
-
Click a level name to jump to the FPS Drops List pre-filtered by that level.
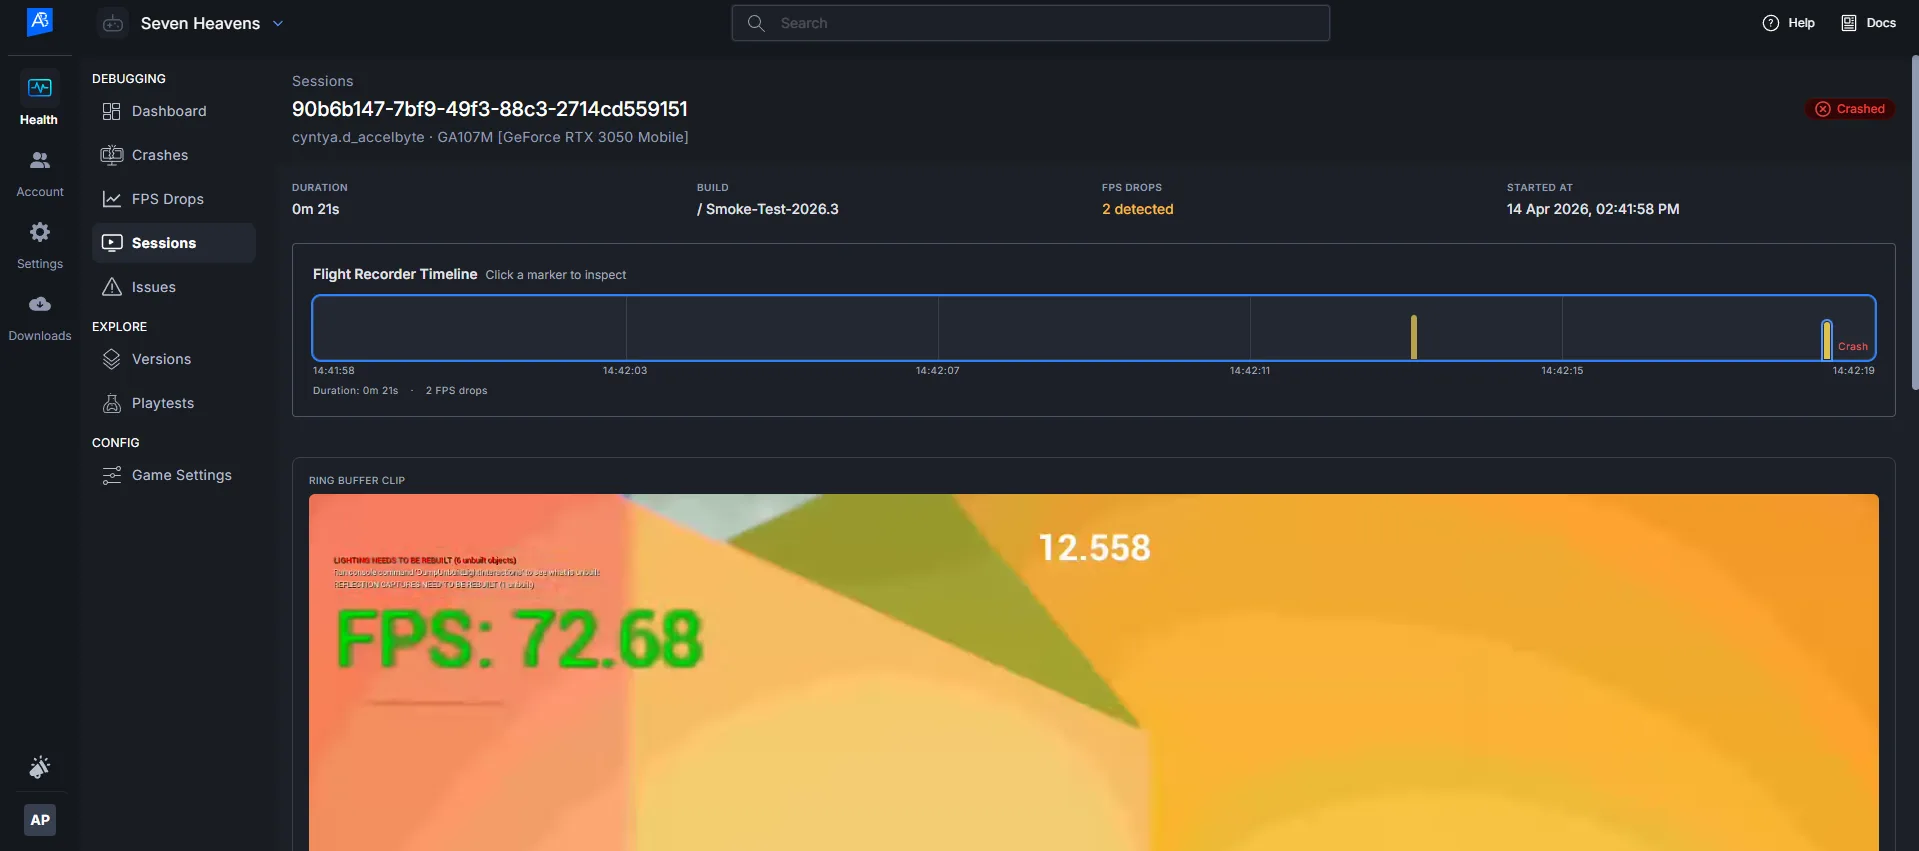
Inspect individual FPS drops on the Flight Recorder:
-
Open a session's detail view (Flight Recorder).
-
Yellow pill markers appear on the timeline at each FPS drop's timestamp. Taller pills indicate more severe drops.
-
Hover a marker to see the timestamp and FPS value.
-
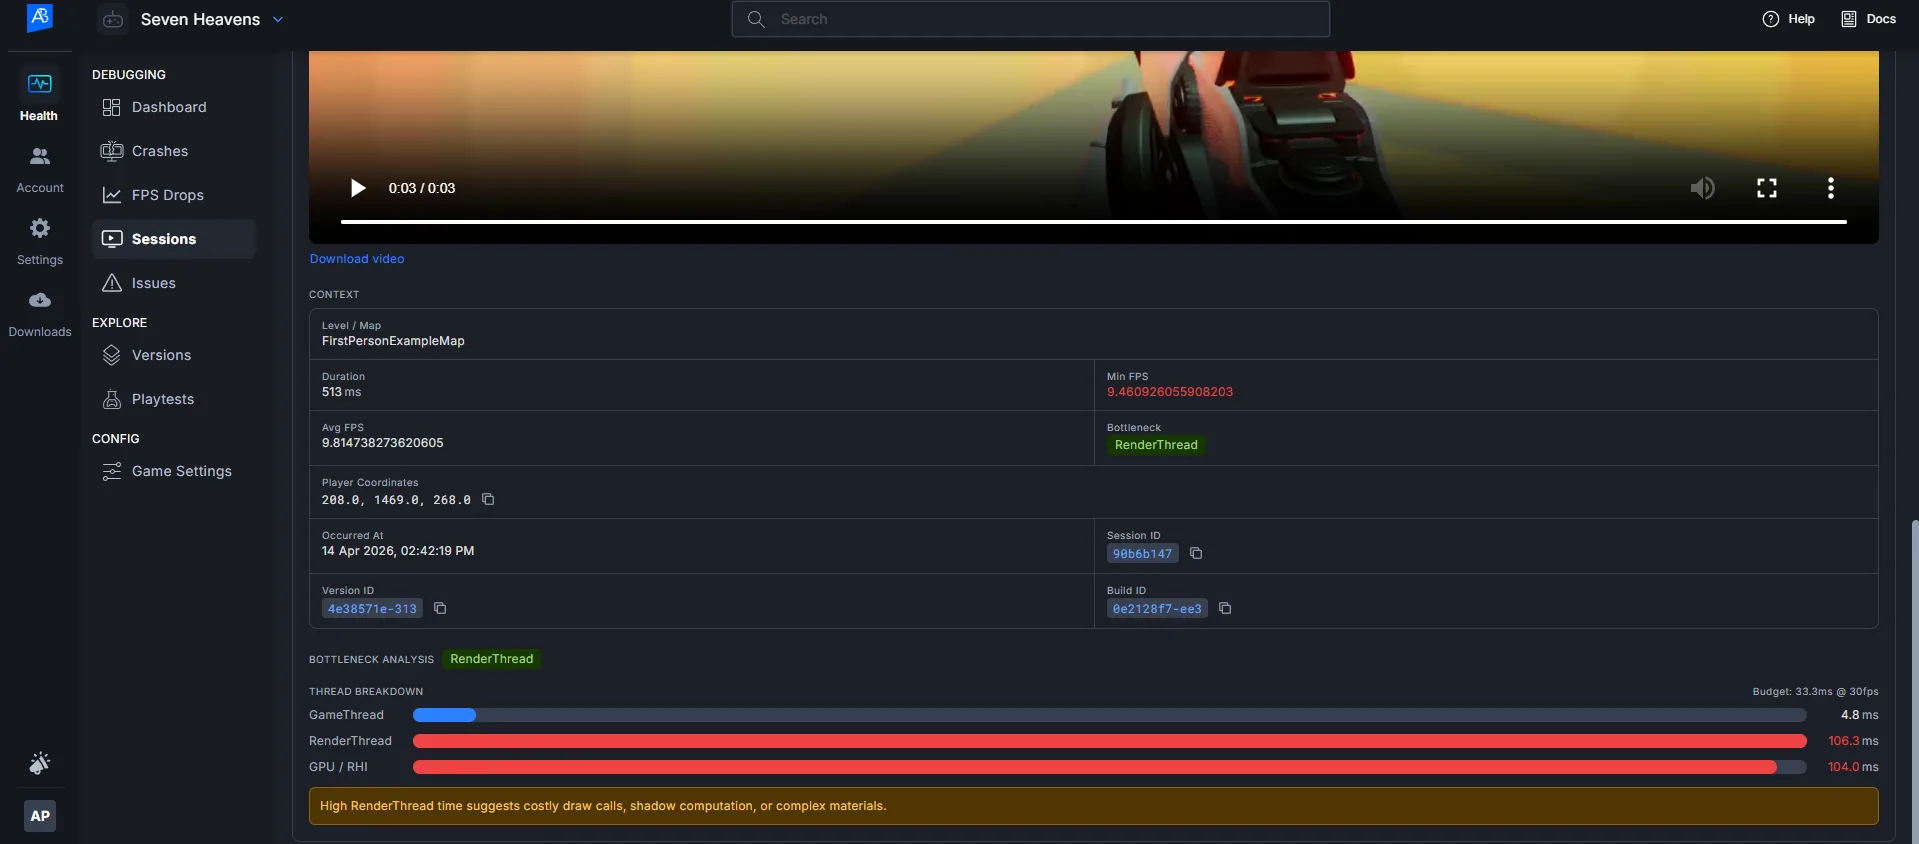
Click a marker to load the Inspector Panel:
-
Video -- 10-second clip auto-plays. Use , and . keys to step frame-by-frame.
-
Stat Unit Bar Chart -- stacked bars for GameThread, RenderThread, and GPU. The dominant bar is highlighted in red when it exceeds the frame budget.
-
Context -- level name, player coordinates, duration, and minimum FPS.
-
-
Use Left/Right arrow keys to navigate between FPS drop markers on the timeline.
Validation
After completing the steps above, verify the setup is working:
-
Detection confirmed -- after running a Development build session through a known performance-heavy area, at least one FPS drop event appears in the FPS Drops List.
-
Video available -- clicking "View Clip" on a FPS drop row plays the 10-second video clip. If the video shows "Video unavailable," the S3 upload may have failed; check ADT Hub for upload errors.
-
Correct bottleneck -- the Bottleneck column shows GameThread, RenderThread, or GPU. Verify this matches your expectation for the area tested (e.g., a scene with heavy blueprint logic should show GameThread).
-
Session status -- the Sessions List shows the correct status badge for sessions with FPS drops.
-
Aggregated view populated -- the Aggregated view groups FPS drops by level and shows occurrence counts.
Troubleshooting
-
No FPS drops detected after a session with obvious hitches Fix: Check your detection thresholds in Project Settings > FPS Drop Detection. If Min FPS is set to 10 and your game drops to 25 FPS, the system does not consider that a drop. Lower your Min FPS threshold or increase the Min Duration to match the type of drops you are targeting.
-
FPS Drop Detection section does not appear in Project Settings Fix: The fps-drop-detection feature in Labs is not enabled for your namespace. Ask a namespace admin to enable it in Namespace Settings > Labs.
-
FPS Drop sidebar item not visible in ADT Web Fix: Same as above. The entire FPS Drop Detection UI is hidden when the Labs is off.
-
Upload fails repeatedly (ADT Hub shows failed payloads) Fix: Verify network connectivity to the ADT backend. Check that the SDK has valid IAM credentials. Failed payloads are retained on disk and retried on the next session start, so no data is lost.
-
Video shows "Video unavailable" in the Inspector Panel Fix: The video clip upload to S3 failed while the metadata upload succeeded. The FPS drop record still contains all profiling data. The video may upload successfully on the next session start retry.
-
FPS drops detected in the editor but not in packaged builds Fix: Ensure you are packaging as a Development build, not a Shipping build. FPS Drop Detection code is stripped from Shipping builds via
#if !UE_BUILD_SHIPPING. -
Policy changes do not take effect mid-session Fix: This is expected behavior. The FPS drop detection policy is read once at session start
(bbx_start_new_session()). Changes to thresholds take effect on the next session. -
Level name shows "Unknown Map" for some FPS drops Fix: This occurs when a FPS drop is confirmed during a level transition when the world reference is temporarily null. The SDK records the level as "Unknown Map" in these cases. The video clip and profiling data are still captured normally.
Next Steps
-
Analyze hotspot areas -- use the Aggregated View to identify which levels have the most FPS drops across sessions and users, then prioritize optimization work.
-
Compare across builds -- use the Build filter in the FPS Drops List to compare FPS drop frequency between builds and verify that performance fixes are effective.
-
Enable Full Profiling (Phase 2) -- when available, opt in to full profiling to capture complete engine trace files. The AI diagnosis engine analyzes these traces to identify the exact functions causing each FPS drop. See the FPS Drop Detection. feature doc for details on the AI diagnosis pipeline.